65 Wagner Rd Westerly, RI 02891
Estimated Value: $1,182,000 - $1,796,176
3
Beds
2
Baths
2,673
Sq Ft
$517/Sq Ft
Est. Value
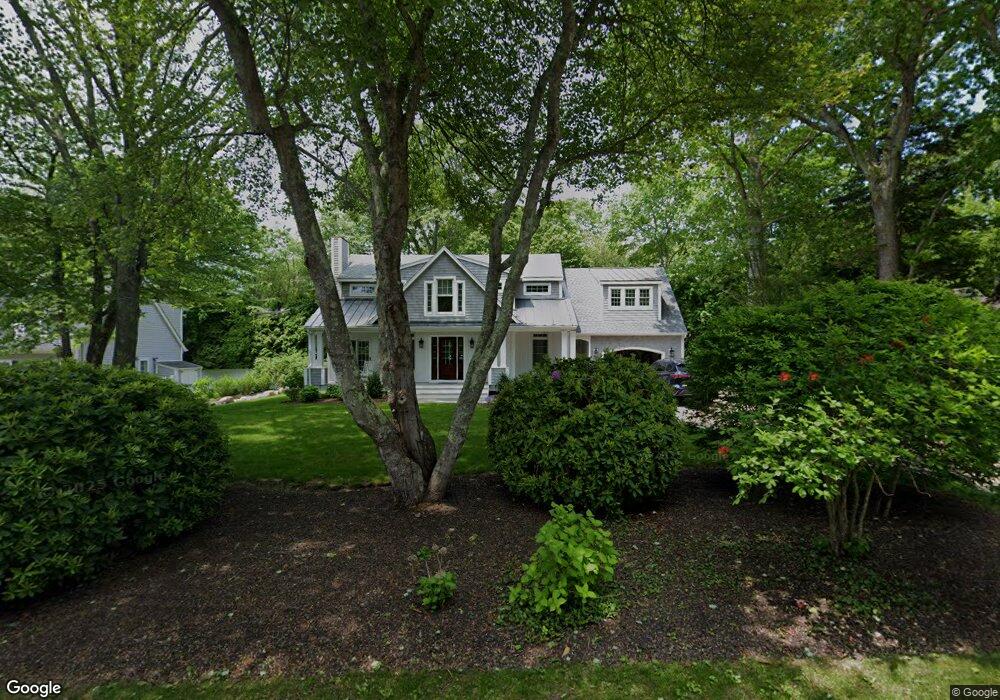
About This Home
This home is located at 65 Wagner Rd, Westerly, RI 02891 and is currently estimated at $1,383,044, approximately $517 per square foot. 65 Wagner Rd is a home located in Washington County with nearby schools including Westerly High School.
Ownership History
Date
Name
Owned For
Owner Type
Purchase Details
Closed on
Mar 18, 2023
Sold by
Joan M Williams Lt and Weeks
Bought by
Gail W Weeks Ret and Weeks
Current Estimated Value
Purchase Details
Closed on
Mar 15, 2023
Sold by
P Adger Williams Lt and Williams
Bought by
Joan M Williams Lt and Weeks
Purchase Details
Closed on
Mar 14, 2019
Sold by
P Adger Williams Lt and Williams
Bought by
Joan M Williams Lt and Williams
Purchase Details
Closed on
May 1, 1985
Bought by
Lt Williams P Adger
Create a Home Valuation Report for This Property
The Home Valuation Report is an in-depth analysis detailing your home's value as well as a comparison with similar homes in the area
Home Values in the Area
Average Home Value in this Area
Purchase History
| Date | Buyer | Sale Price | Title Company |
|---|---|---|---|
| Gail W Weeks Ret | -- | None Available | |
| Gail W Weeks Ret | -- | None Available | |
| Gail W Weeks Ret | -- | None Available | |
| Joan M Williams Lt | -- | None Available | |
| Joan M Williams Lt | -- | None Available | |
| Joan M Williams Lt | -- | None Available | |
| Joan M Williams Lt | -- | -- | |
| Joan M Williams Lt | -- | -- | |
| Joan M Williams Lt | -- | -- | |
| Lt Williams P Adger | -- | -- |
Source: Public Records
Tax History
| Year | Tax Paid | Tax Assessment Tax Assessment Total Assessment is a certain percentage of the fair market value that is determined by local assessors to be the total taxable value of land and additions on the property. | Land | Improvement |
|---|---|---|---|---|
| 2025 | $10,868 | $1,528,500 | $648,600 | $879,900 |
| 2024 | $5,963 | $607,800 | $463,200 | $144,600 |
| 2023 | $7,654 | $795,600 | $463,200 | $332,400 |
| 2022 | $7,606 | $795,600 | $463,200 | $332,400 |
| 2021 | $6,720 | $583,300 | $332,400 | $250,900 |
| 2020 | $6,597 | $583,300 | $332,400 | $250,900 |
| 2019 | $6,533 | $583,300 | $332,400 | $250,900 |
| 2018 | $6,073 | $511,200 | $302,200 | $209,000 |
| 2017 | $5,925 | $511,200 | $302,200 | $209,000 |
| 2016 | $5,971 | $511,200 | $302,200 | $209,000 |
| 2015 | $5,606 | $518,100 | $308,400 | $209,700 |
| 2014 | $5,513 | $518,100 | $308,400 | $209,700 |
Source: Public Records
Map
Nearby Homes
- 346 Post Rd
- 137 Cove Point Rd E
- 342 Post Rd
- 14 Evergreen Ln
- 853 W Beach Rd
- 43 Noyes Neck Rd
- 5 Robin Hollow Ln
- 112 Noyes Neck Rd
- 11 Bucks Trail
- 7 Fenway Rd
- 135 Ross Hill Rd
- 34 Buddington Rd
- 143 Ross Hill Rd
- 15 Breach Dr
- 5717 Post Rd
- 22 Breach Dr
- 30 Clifford Dr
- 20 Snowberry Ln
- 46 Salt Pond Way
- 13 Plateau Rd
Your Personal Tour Guide
Ask me questions while you tour the home.