Estimated Value: $1,121,000 - $1,431,000
4
Beds
3
Baths
2,690
Sq Ft
$462/Sq Ft
Est. Value
About This Home
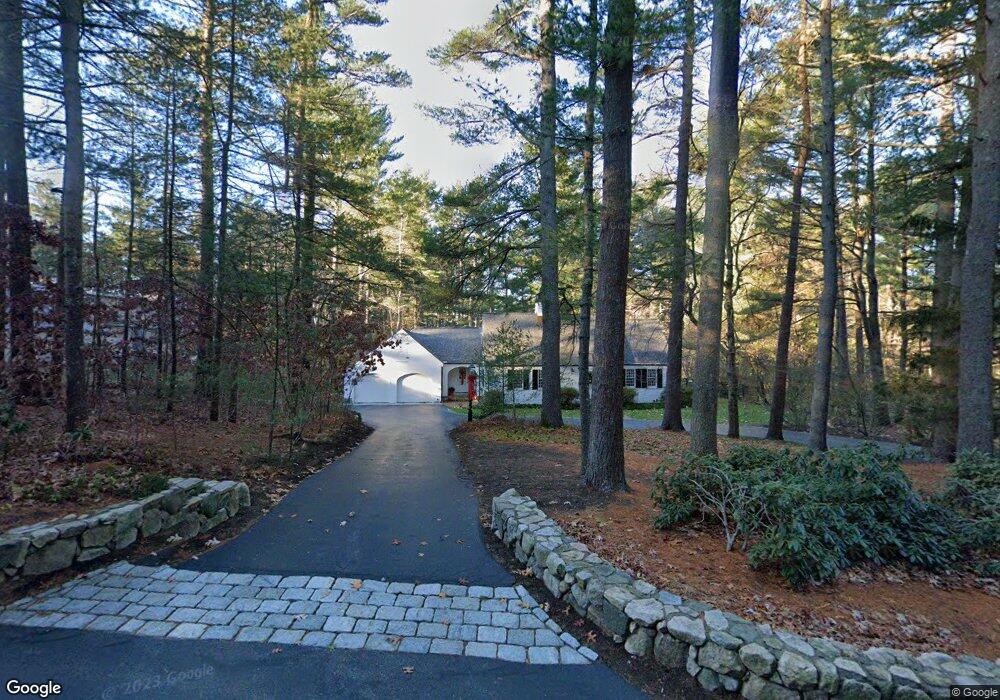
This home is located at 65 Walpole St, Dover, MA 02030 and is currently estimated at $1,242,667, approximately $461 per square foot. 65 Walpole St is a home located in Norfolk County with nearby schools including Chickering Elementary School, Dover-Sherborn Regional Middle School, and Dover-Sherborn Regional High School.
Ownership History
Date
Name
Owned For
Owner Type
Purchase Details
Closed on
Jul 31, 1991
Sold by
Bartlett Sue H
Bought by
Haas Robert C and Haas Helen A
Current Estimated Value
Home Financials for this Owner
Home Financials are based on the most recent Mortgage that was taken out on this home.
Original Mortgage
$150,000
Interest Rate
9.58%
Mortgage Type
Purchase Money Mortgage
Create a Home Valuation Report for This Property
The Home Valuation Report is an in-depth analysis detailing your home's value as well as a comparison with similar homes in the area
Home Values in the Area
Average Home Value in this Area
Purchase History
| Date | Buyer | Sale Price | Title Company |
|---|---|---|---|
| Haas Robert C | $300,000 | -- |
Source: Public Records
Mortgage History
| Date | Status | Borrower | Loan Amount |
|---|---|---|---|
| Closed | Haas Robert C | $25,000 | |
| Closed | Haas Robert C | $100,000 | |
| Closed | Haas Robert C | $150,000 |
Source: Public Records
Tax History
| Year | Tax Paid | Tax Assessment Tax Assessment Total Assessment is a certain percentage of the fair market value that is determined by local assessors to be the total taxable value of land and additions on the property. | Land | Improvement |
|---|---|---|---|---|
| 2025 | $11,502 | $1,020,600 | $664,400 | $356,200 |
| 2024 | $11,186 | $1,020,600 | $664,400 | $356,200 |
| 2023 | $10,071 | $826,200 | $522,800 | $303,400 |
| 2022 | $9,912 | $798,100 | $522,800 | $275,300 |
| 2021 | $10,709 | $830,800 | $522,800 | $308,000 |
| 2020 | $10,667 | $830,800 | $522,800 | $308,000 |
| 2019 | $11,377 | $879,900 | $522,800 | $357,100 |
| 2018 | $9,770 | $760,900 | $427,000 | $333,900 |
| 2017 | $9,759 | $747,800 | $413,900 | $333,900 |
| 2016 | $9,713 | $754,100 | $413,900 | $340,200 |
| 2015 | $9,098 | $716,400 | $413,900 | $302,500 |
Source: Public Records
Map
Nearby Homes
Your Personal Tour Guide
Ask me questions while you tour the home.