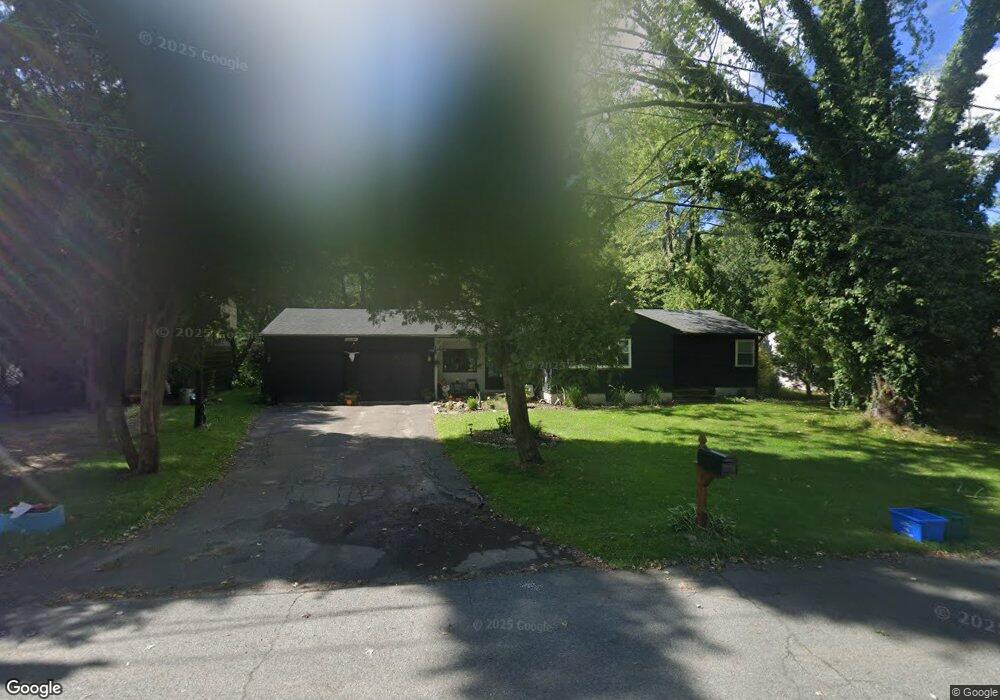
65 Westbrook Rd South Hadley, MA 01075
Estimated Value: $340,000 - $386,000
3
Beds
1
Bath
1,344
Sq Ft
$271/Sq Ft
Est. Value
About This Home
This home is located at 65 Westbrook Rd, South Hadley, MA 01075 and is currently estimated at $363,897, approximately $270 per square foot. 65 Westbrook Rd is a home located in Hampshire County with nearby schools including Plains Elementary School, Mosier Elementary School, and Michael E. Smith Middle School.
Ownership History
Date
Name
Owned For
Owner Type
Purchase Details
Closed on
Aug 3, 2021
Sold by
Werbiskis Gary E
Bought by
Whalen Joseph D and Connery Chloe J
Current Estimated Value
Home Financials for this Owner
Home Financials are based on the most recent Mortgage that was taken out on this home.
Original Mortgage
$135,000
Outstanding Balance
$122,812
Interest Rate
2.93%
Mortgage Type
Purchase Money Mortgage
Estimated Equity
$241,085
Purchase Details
Closed on
Dec 11, 2009
Sold by
Werbiskis Michael J
Bought by
Werbiskis Gary E
Create a Home Valuation Report for This Property
The Home Valuation Report is an in-depth analysis detailing your home's value as well as a comparison with similar homes in the area
Home Values in the Area
Average Home Value in this Area
Purchase History
| Date | Buyer | Sale Price | Title Company |
|---|---|---|---|
| Whalen Joseph D | $150,000 | None Available | |
| Werbiskis Gary E | -- | -- |
Source: Public Records
Mortgage History
| Date | Status | Borrower | Loan Amount |
|---|---|---|---|
| Open | Whalen Joseph D | $135,000 |
Source: Public Records
Tax History Compared to Growth
Tax History
| Year | Tax Paid | Tax Assessment Tax Assessment Total Assessment is a certain percentage of the fair market value that is determined by local assessors to be the total taxable value of land and additions on the property. | Land | Improvement |
|---|---|---|---|---|
| 2025 | $5,010 | $314,500 | $138,900 | $175,600 |
| 2024 | $4,990 | $299,700 | $129,800 | $169,900 |
| 2023 | $4,702 | $267,900 | $118,100 | $149,800 |
| 2022 | $4,561 | $246,800 | $118,100 | $128,700 |
| 2021 | $4,487 | $230,600 | $110,200 | $120,400 |
| 2020 | $4,435 | $222,400 | $110,200 | $112,200 |
| 2019 | $4,306 | $213,700 | $105,000 | $108,700 |
| 2018 | $4,271 | $214,300 | $101,800 | $112,500 |
| 2017 | $4,149 | $206,200 | $101,800 | $104,400 |
| 2016 | $3,899 | $196,400 | $92,900 | $103,500 |
| 2015 | $3,696 | $190,700 | $90,100 | $100,600 |
Source: Public Records
Map
Nearby Homes
- 540 Granby Rd Unit 72A
- 540 Granby Rd Unit 114
- 540 Granby Rd Unit 109
- 586 Granby Rd
- 18 Sunset Ave
- 2 Circle Dr
- 70 Pine Grove Dr Unit 70
- 30 Pine Grove Dr
- 341 East St
- 19 Hildreth Ave
- 15 Stanton Ave
- 73 Pine Grove Dr
- 7 Burnett Ave
- 15 Karen Dr
- 108 College St
- 96 College St
- 30 Yale St
- 97 College St Unit A
- 63 Washington Ave
- 31 College View Heights
- 63 Westbrook Rd
- 67 Westbrook Rd
- 61 Westbrook Rd
- 69 Westbrook Rd
- 64 Westbrook Rd
- 66 Westbrook Rd
- 62 Westbrook Rd
- 68 Westbrook Rd
- 36 Saybrook Cir
- 71 Westbrook Rd
- 59 Westbrook Rd
- 19 Cypress Dr
- 17 Cypress Dr
- 34 Saybrook Cir
- 56 Westbrook Rd
- 13 Cypress Dr
- 57 Westbrook Rd
- 15 Cypress Dr
- 32 Saybrook Cir
- 22 Cypress Dr