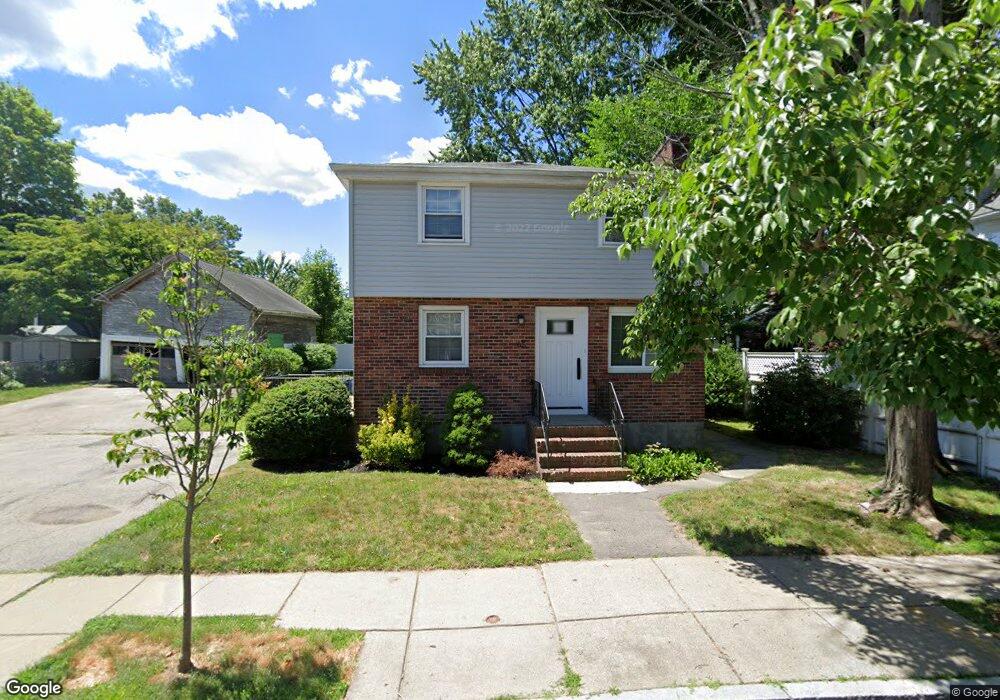
65 Wren St West Roxbury, MA 02132
Bellevue Hill NeighborhoodEstimated Value: $942,000 - $1,198,000
4
Beds
2
Baths
2,280
Sq Ft
$470/Sq Ft
Est. Value
About This Home
This home is located at 65 Wren St, West Roxbury, MA 02132 and is currently estimated at $1,072,083, approximately $470 per square foot. 65 Wren St is a home located in Suffolk County with nearby schools including St Theresa School, Holy Name Parish School, and The Roxbury Latin School.
Ownership History
Date
Name
Owned For
Owner Type
Purchase Details
Closed on
Jul 22, 2016
Sold by
Lambrenos Constantine and Lambrenos Christina
Bought by
Zangi Ronen
Current Estimated Value
Home Financials for this Owner
Home Financials are based on the most recent Mortgage that was taken out on this home.
Original Mortgage
$440,250
Outstanding Balance
$351,679
Interest Rate
3.6%
Mortgage Type
New Conventional
Estimated Equity
$720,404
Create a Home Valuation Report for This Property
The Home Valuation Report is an in-depth analysis detailing your home's value as well as a comparison with similar homes in the area
Home Values in the Area
Average Home Value in this Area
Purchase History
| Date | Buyer | Sale Price | Title Company |
|---|---|---|---|
| Zangi Ronen | $600,000 | -- |
Source: Public Records
Mortgage History
| Date | Status | Borrower | Loan Amount |
|---|---|---|---|
| Open | Zangi Ronen | $440,250 |
Source: Public Records
Tax History Compared to Growth
Tax History
| Year | Tax Paid | Tax Assessment Tax Assessment Total Assessment is a certain percentage of the fair market value that is determined by local assessors to be the total taxable value of land and additions on the property. | Land | Improvement |
|---|---|---|---|---|
| 2025 | $11,960 | $1,032,800 | $510,600 | $522,200 |
| 2024 | $10,710 | $982,600 | $419,700 | $562,900 |
| 2023 | $9,859 | $918,000 | $392,100 | $525,900 |
| 2022 | $9,422 | $866,000 | $369,900 | $496,100 |
| 2021 | $8,400 | $787,300 | $336,300 | $451,000 |
| 2020 | $7,532 | $713,300 | $311,600 | $401,700 |
| 2019 | $7,107 | $674,300 | $255,500 | $418,800 |
| 2018 | $6,604 | $630,200 | $255,500 | $374,700 |
| 2017 | $6,356 | $600,200 | $255,500 | $344,700 |
| 2016 | $6,228 | $566,200 | $255,500 | $310,700 |
| 2015 | $5,900 | $487,200 | $216,700 | $270,500 |
| 2014 | $5,864 | $466,100 | $216,700 | $249,400 |
Source: Public Records
Map
Nearby Homes
- 73 Woodard Rd
- 152 Stratford St
- 54 Sturges Rd
- 348 Lagrange St
- 275 Bellevue St
- 145 Lagrange St
- 110 Park St Unit 3
- 416 Belgrade Ave Unit 25
- 425 Lagrange St Unit 203
- 12 Loyola Cir
- 37 Hastings St Unit 103
- 27-29 Temple St
- 311 Belgrade Ave
- 95 Newburg St
- 76 Potomac St
- 73 Dent St Unit 1
- 257 Belgrade Ave
- 539 Lagrange St
- 242 Belgrade Ave
- 2 Lagrange St Unit 4
- 65 Wren St Unit 2
- 65 Wren St Unit 1
- 61 Wren St
- 41 Oriole St
- 37 Oriole St
- 37 Oriole St Unit 1
- 59 Wren St
- 70 Wren St Unit 2
- 70 Wren St Unit 1
- 70 Wren St
- 45 Oriole St
- 45 Oriole St Unit 1
- 29 Oriole St
- 58 Wren St
- 8 Danville St
- 4 Danville St
- 12 Danville St
- 25 Oriole St
- 25 Oriole St Unit 1
- 25 Oriole St Unit 2