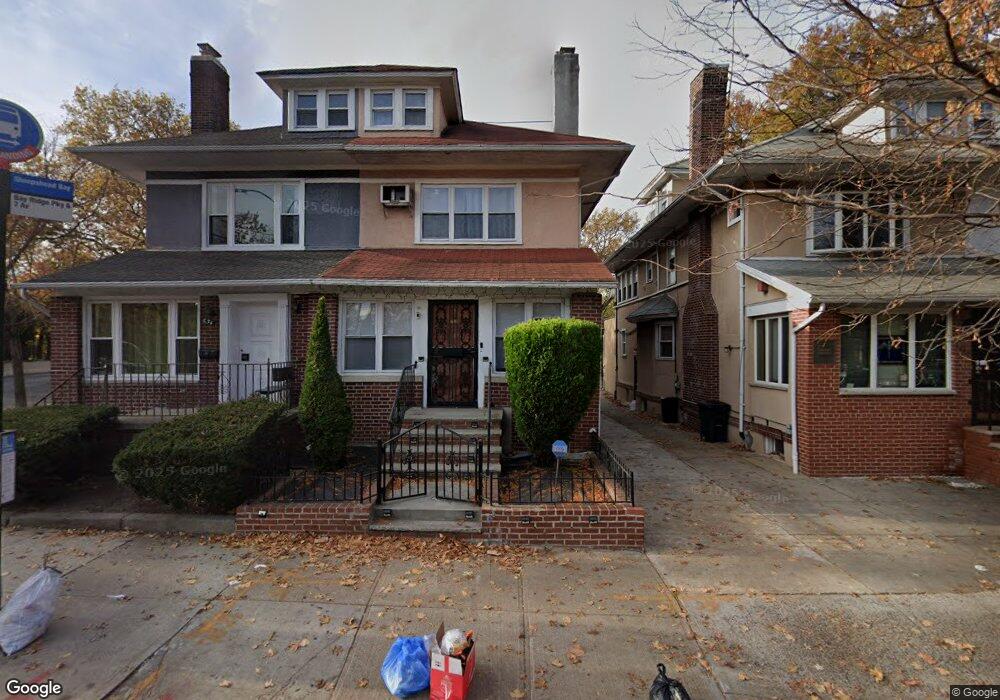
650 Bay Ridge Pkwy Unit 1 Brooklyn, NY 11209
Bay Ridge NeighborhoodEstimated Value: $1,034,000 - $1,439,000
--
Bed
--
Bath
1,707
Sq Ft
$729/Sq Ft
Est. Value
About This Home
This home is located at 650 Bay Ridge Pkwy Unit 1, Brooklyn, NY 11209 and is currently estimated at $1,244,614, approximately $729 per square foot. 650 Bay Ridge Pkwy Unit 1 is a home located in Kings County with nearby schools including Junior High School 259 William McKinley, Fort Hamilton High School, and St Ephrem School.
Ownership History
Date
Name
Owned For
Owner Type
Purchase Details
Closed on
Feb 26, 2003
Sold by
Chokshi Dharmesh
Bought by
Chokshi Dharmesh and Chokshi Varsha D
Current Estimated Value
Purchase Details
Closed on
Jan 22, 1999
Sold by
Said Joseph O
Bought by
Chokshi Dharmesh
Home Financials for this Owner
Home Financials are based on the most recent Mortgage that was taken out on this home.
Original Mortgage
$261,000
Interest Rate
6.95%
Purchase Details
Closed on
Jun 15, 1994
Sold by
Siad Mufeed
Bought by
Said Joseph O and Said Nawal
Home Financials for this Owner
Home Financials are based on the most recent Mortgage that was taken out on this home.
Original Mortgage
$120,000
Interest Rate
8.55%
Create a Home Valuation Report for This Property
The Home Valuation Report is an in-depth analysis detailing your home's value as well as a comparison with similar homes in the area
Home Values in the Area
Average Home Value in this Area
Purchase History
| Date | Buyer | Sale Price | Title Company |
|---|---|---|---|
| Chokshi Dharmesh | -- | -- | |
| Chokshi Dharmesh | -- | -- | |
| Chokshi Dharmesh | $290,000 | Ati Title | |
| Chokshi Dharmesh | $290,000 | Ati Title | |
| Said Joseph O | -- | -- | |
| Said Joseph O | -- | -- |
Source: Public Records
Mortgage History
| Date | Status | Borrower | Loan Amount |
|---|---|---|---|
| Previous Owner | Chokshi Dharmesh | $261,000 | |
| Previous Owner | Said Joseph O | $120,000 | |
| Closed | Chokshi Dharmesh | $0 |
Source: Public Records
Tax History Compared to Growth
Tax History
| Year | Tax Paid | Tax Assessment Tax Assessment Total Assessment is a certain percentage of the fair market value that is determined by local assessors to be the total taxable value of land and additions on the property. | Land | Improvement |
|---|---|---|---|---|
| 2025 | $9,931 | $73,800 | $17,580 | $56,220 |
| 2024 | $9,931 | $74,640 | $17,580 | $57,060 |
| 2023 | $9,518 | $79,860 | $17,580 | $62,280 |
| 2022 | $8,553 | $70,020 | $17,580 | $52,440 |
| 2021 | $8,571 | $72,900 | $17,580 | $55,320 |
| 2020 | $4,259 | $70,860 | $17,580 | $53,280 |
| 2019 | $8,327 | $70,860 | $17,580 | $53,280 |
| 2018 | $7,664 | $39,055 | $14,023 | $25,032 |
| 2017 | $7,223 | $36,903 | $10,695 | $26,208 |
| 2016 | $6,709 | $35,112 | $10,498 | $24,614 |
| 2015 | $3,979 | $35,108 | $14,342 | $20,766 |
| 2014 | $3,979 | $34,338 | $13,993 | $20,345 |
Source: Public Records
Map
Nearby Homes
- 650 Bay Ridge Pkwy
- 648 Bay Ridge Pkwy
- 654 Bay Ridge Pkwy
- 646 Bay Ridge Pkwy
- 642 Bay Ridge Pkwy
- 640 Bay Ridge Pkwy
- 640 Bay Ridge Pkwy Unit Building
- 645 76th St
- 649 76th St
- 651 76th St
- 643 76th St
- 643 76th St Unit Building
- 653 76th St
- 641 76th St
- 639 76th St
- 637 76th St
- 635 76th St
- 633 76th St
- 659 Bay Ridge Pkwy
- 631 76th St