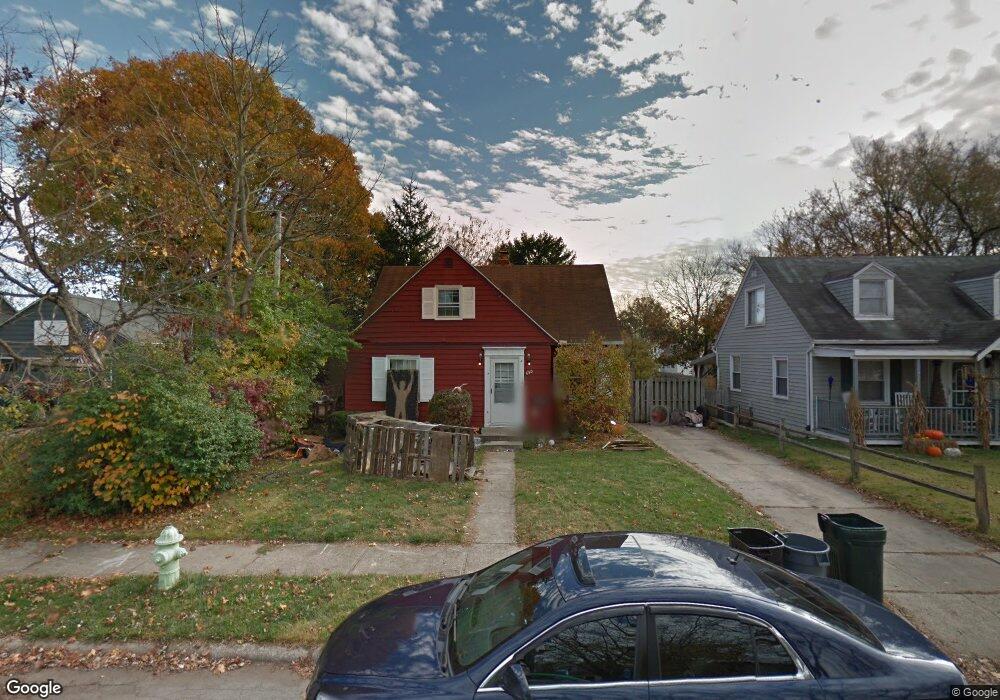
650 June Dr Fairborn, OH 45324
Estimated Value: $177,006 - $182,000
3
Beds
1
Bath
1,131
Sq Ft
$159/Sq Ft
Est. Value
About This Home
This home is located at 650 June Dr, Fairborn, OH 45324 and is currently estimated at $180,002, approximately $159 per square foot. 650 June Dr is a home located in Greene County with nearby schools including Fairborn Primary School, Fairborn Intermediate School, and Fairborn Middle School.
Ownership History
Date
Name
Owned For
Owner Type
Purchase Details
Closed on
Dec 6, 2021
Sold by
Phillips Caitlin
Bought by
Stupak Henry C and Lemaster Kelly J
Current Estimated Value
Home Financials for this Owner
Home Financials are based on the most recent Mortgage that was taken out on this home.
Original Mortgage
$111,920
Outstanding Balance
$101,627
Interest Rate
3.09%
Mortgage Type
Purchase Money Mortgage
Estimated Equity
$78,375
Purchase Details
Closed on
Jun 16, 2020
Sold by
Wilhelm Harold L and Wilhelm Matthew T
Bought by
Phillips Caitlin
Home Financials for this Owner
Home Financials are based on the most recent Mortgage that was taken out on this home.
Original Mortgage
$113,407
Interest Rate
3.2%
Mortgage Type
FHA
Purchase Details
Closed on
Nov 2, 2016
Bought by
Wilhelm Harold L
Purchase Details
Closed on
Apr 21, 2009
Sold by
Wilhelm Harold L and Wilhelm Lezleigh K
Bought by
Wilhelm Louise F
Purchase Details
Closed on
Oct 4, 2002
Sold by
Estate Of Harold Lamar Wilhelm Sr
Bought by
Wilhelm Louise F
Create a Home Valuation Report for This Property
The Home Valuation Report is an in-depth analysis detailing your home's value as well as a comparison with similar homes in the area
Home Values in the Area
Average Home Value in this Area
Purchase History
| Date | Buyer | Sale Price | Title Company |
|---|---|---|---|
| Stupak Henry C | $139,900 | Wave Title Agency Inc | |
| Phillips Caitlin | $115,500 | Chicago Title Company Llc | |
| Wilhelm Harold L | -- | -- | |
| Wilhelm Louise F | -- | Attorney | |
| Wilhelm Louise F | -- | -- |
Source: Public Records
Mortgage History
| Date | Status | Borrower | Loan Amount |
|---|---|---|---|
| Open | Stupak Henry C | $111,920 | |
| Closed | Phillips Caitlin | $113,407 |
Source: Public Records
Tax History
| Year | Tax Paid | Tax Assessment Tax Assessment Total Assessment is a certain percentage of the fair market value that is determined by local assessors to be the total taxable value of land and additions on the property. | Land | Improvement |
|---|---|---|---|---|
| 2025 | $2,329 | $48,280 | $9,300 | $38,980 |
| 2024 | $2,329 | $48,280 | $9,300 | $38,980 |
| 2023 | $2,312 | $48,280 | $9,300 | $38,980 |
| 2022 | $2,029 | $35,670 | $5,470 | $30,200 |
| 2021 | $2,059 | $23,330 | $5,470 | $17,860 |
| 2020 | $1,354 | $23,330 | $5,470 | $17,860 |
| 2019 | $1,148 | $19,800 | $5,360 | $14,440 |
| 2018 | $1,160 | $19,800 | $5,360 | $14,440 |
| 2017 | $1,169 | $19,800 | $5,360 | $14,440 |
| 2016 | $1,169 | $19,950 | $5,360 | $14,590 |
| 2015 | $1,115 | $19,950 | $5,360 | $14,590 |
| 2014 | $1,078 | $19,950 | $5,360 | $14,590 |
Source: Public Records
Map
Nearby Homes
- 621 June Dr
- 303 E Whittier Ave
- 801-803 Winston Dr
- 827 Mitman Dr
- 261 Archer Dr
- 313 Archer Dr
- 106 E Hebble Ave
- 711 N Central Ave
- 000 Morris Dr
- 388-390 Morris Dr Unit 388
- 323 Mann Ave
- 112 Mann Ave
- 308 E Xenia Dr
- 112 E Xenia Dr
- 1126 Adams St
- 1222 Oakhill Ave
- 139 Hower Ln
- 226-230 N Broad St
- 437 Kirkwood Dr
- 315 W Dayton Dr
Your Personal Tour Guide
Ask me questions while you tour the home.