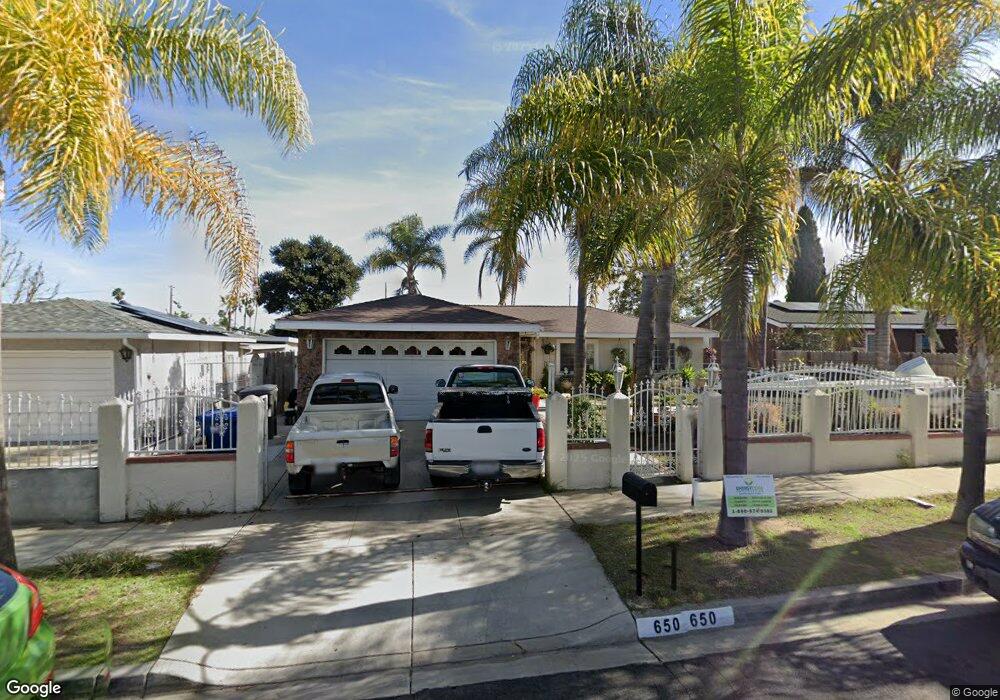
650 Michael St Oceanside, CA 92057
North Valley NeighborhoodEstimated Value: $743,000 - $797,000
4
Beds
2
Baths
1,192
Sq Ft
$643/Sq Ft
Est. Value
About This Home
This home is located at 650 Michael St, Oceanside, CA 92057 and is currently estimated at $766,992, approximately $643 per square foot. 650 Michael St is a home located in San Diego County with nearby schools including Libby Elementary School, Cesar Chavez Middle School, and El Camino High School.
Ownership History
Date
Name
Owned For
Owner Type
Purchase Details
Closed on
Jan 28, 2005
Sold by
Prieto Antonio and Prieto Lucia
Bought by
Mejia Luis M
Current Estimated Value
Home Financials for this Owner
Home Financials are based on the most recent Mortgage that was taken out on this home.
Original Mortgage
$308,000
Outstanding Balance
$145,211
Interest Rate
4.66%
Mortgage Type
Purchase Money Mortgage
Estimated Equity
$621,782
Purchase Details
Closed on
Feb 6, 1990
Purchase Details
Closed on
Dec 29, 1989
Create a Home Valuation Report for This Property
The Home Valuation Report is an in-depth analysis detailing your home's value as well as a comparison with similar homes in the area
Home Values in the Area
Average Home Value in this Area
Purchase History
| Date | Buyer | Sale Price | Title Company |
|---|---|---|---|
| Mejia Luis M | $440,000 | Chicago Title Co | |
| -- | $128,000 | -- | |
| -- | $118,300 | -- |
Source: Public Records
Mortgage History
| Date | Status | Borrower | Loan Amount |
|---|---|---|---|
| Open | Mejia Luis M | $308,000 |
Source: Public Records
Tax History
| Year | Tax Paid | Tax Assessment Tax Assessment Total Assessment is a certain percentage of the fair market value that is determined by local assessors to be the total taxable value of land and additions on the property. | Land | Improvement |
|---|---|---|---|---|
| 2025 | $8,840 | $613,270 | $432,078 | $181,192 |
| 2024 | $8,840 | $601,246 | $423,606 | $177,640 |
| 2023 | $8,632 | $589,457 | $415,300 | $174,157 |
| 2022 | $8,533 | $577,900 | $407,157 | $170,743 |
| 2021 | $5,314 | $470,000 | $282,000 | $188,000 |
| 2020 | $4,758 | $430,000 | $258,000 | $172,000 |
| 2019 | $4,381 | $400,000 | $240,000 | $160,000 |
| 2018 | $4,086 | $370,000 | $222,000 | $148,000 |
| 2017 | $3,757 | $340,000 | $204,000 | $136,000 |
| 2016 | $3,377 | $310,000 | $186,000 | $124,000 |
| 2015 | $3,220 | $300,000 | $180,000 | $120,000 |
| 2014 | $2,626 | $250,000 | $150,000 | $100,000 |
Source: Public Records
Map
Nearby Homes
- 656 Parker St
- 671 Parker St
- 868 Panella Ct
- 663 Charles Dr
- 905 Glendora Dr
- 924 Glendora Dr
- 569 Gold Dr
- 5015 Macario Dr
- 1359 Corte Alveo
- 150 N River Cir Unit 105
- 5033 Los Morros Way Unit 55
- 5133 Greenbrook St
- 4950 Luna Dr
- 5065 Waterview Way Unit 101
- 5063 Waterview Way Unit 102
- 5063 Waterview Way Unit 101
- 5074 Cascade Way Unit 102
- 4856 Cardiff Bay Dr Unit 911
- 1039 Eliot St
- 4924 Verde Dr
Your Personal Tour Guide
Ask me questions while you tour the home.