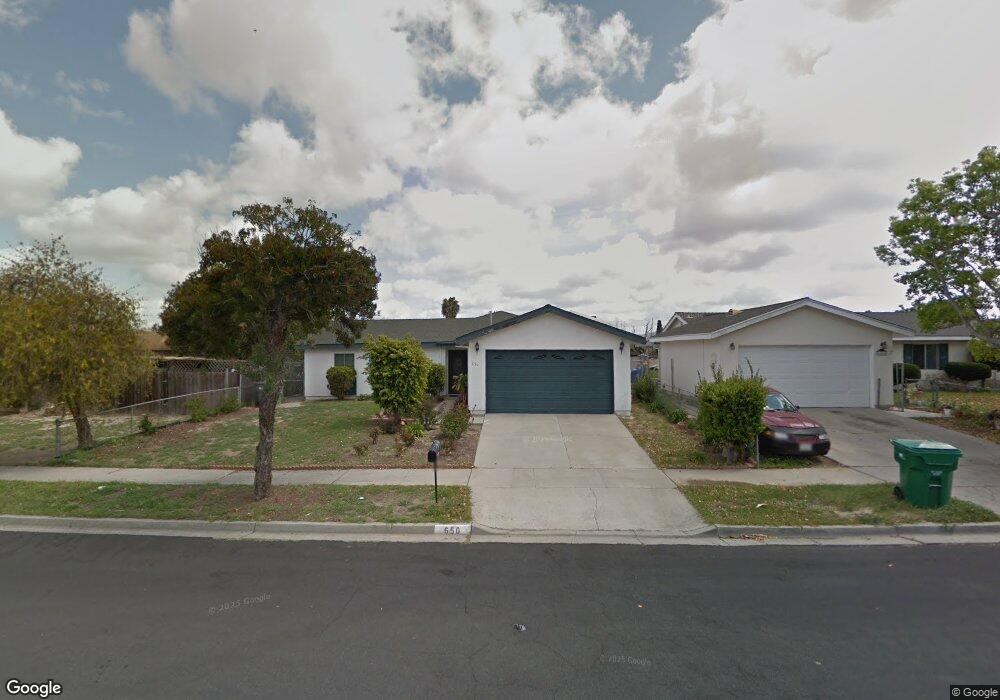
650 Parker St Oceanside, CA 92057
North Valley NeighborhoodEstimated Value: $615,210 - $784,000
4
Beds
2
Baths
1,192
Sq Ft
$593/Sq Ft
Est. Value
About This Home
This home is located at 650 Parker St, Oceanside, CA 92057 and is currently estimated at $706,303, approximately $592 per square foot. 650 Parker St is a home located in San Diego County with nearby schools including Libby Elementary School, Cesar Chavez Middle School, and Peppertree Montessori School.
Ownership History
Date
Name
Owned For
Owner Type
Purchase Details
Closed on
Sep 22, 1994
Sold by
Resolution Trust Corp
Bought by
Cone John P and Cone Raquel R
Current Estimated Value
Home Financials for this Owner
Home Financials are based on the most recent Mortgage that was taken out on this home.
Original Mortgage
$103,020
Interest Rate
8.5%
Mortgage Type
VA
Purchase Details
Closed on
Jun 10, 1994
Sold by
Resolution Trust Corp
Bought by
Homefed Bank Fa
Purchase Details
Closed on
Jun 22, 1989
Purchase Details
Closed on
Jan 25, 1989
Purchase Details
Closed on
Jan 11, 1985
Create a Home Valuation Report for This Property
The Home Valuation Report is an in-depth analysis detailing your home's value as well as a comparison with similar homes in the area
Home Values in the Area
Average Home Value in this Area
Purchase History
| Date | Buyer | Sale Price | Title Company |
|---|---|---|---|
| Cone John P | $101,000 | Westland Title Company | |
| Homefed Bank Fa | $97,013 | Westland Title Company | |
| -- | $122,500 | -- | |
| -- | $81,500 | -- | |
| -- | $81,000 | -- |
Source: Public Records
Mortgage History
| Date | Status | Borrower | Loan Amount |
|---|---|---|---|
| Closed | Cone John P | $103,020 |
Source: Public Records
Tax History Compared to Growth
Tax History
| Year | Tax Paid | Tax Assessment Tax Assessment Total Assessment is a certain percentage of the fair market value that is determined by local assessors to be the total taxable value of land and additions on the property. | Land | Improvement |
|---|---|---|---|---|
| 2025 | $2,286 | $210,983 | $75,721 | $135,262 |
| 2024 | $2,286 | $206,847 | $74,237 | $132,610 |
| 2023 | $2,214 | $202,792 | $72,782 | $130,010 |
| 2022 | $2,179 | $198,816 | $71,355 | $127,461 |
| 2021 | $2,186 | $194,918 | $69,956 | $124,962 |
| 2020 | $2,118 | $192,920 | $69,239 | $123,681 |
| 2019 | $2,056 | $189,138 | $67,882 | $121,256 |
| 2018 | $2,033 | $185,430 | $66,551 | $118,879 |
| 2017 | $70 | $181,796 | $65,247 | $116,549 |
| 2016 | $1,928 | $178,232 | $63,968 | $114,264 |
| 2015 | $1,872 | $175,556 | $63,008 | $112,548 |
| 2014 | $1,799 | $172,118 | $61,774 | $110,344 |
Source: Public Records
Map
Nearby Homes
- 671 Parker St
- 868 Panella Ct
- 4795 Stephanie Place
- 5014 El Mirlo Dr
- 530 Roja Dr
- 5037 Los Morros Way Unit 71
- 984 Manteca Dr
- 4949 Luna Dr
- 4947 Luna Dr
- 5108 Eliot St
- 1247 Bellingham Dr
- 361 Point Windemere Place
- 5116 Weymouth Way
- 0 Indian View Dr
- 1473 Salem Ct
- 1447 Puritan Dr
- 1061 Boulder Place
- 1477 Salem Ct
- 1479 Puritan Dr
- 1120 Parkview Dr