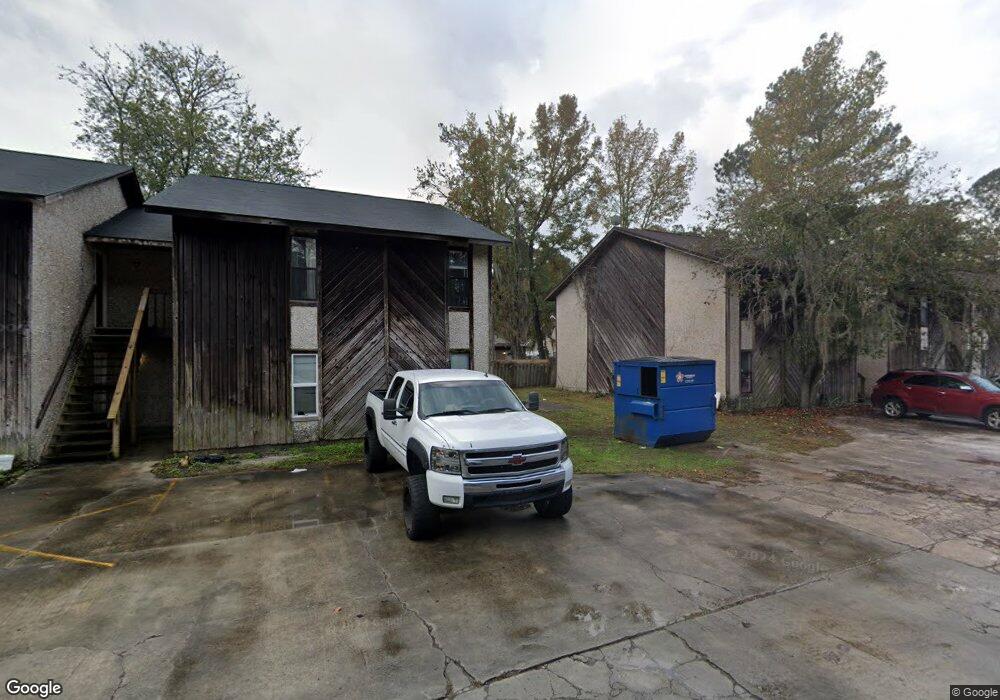
650 Tupelo Trail Unit 2A Hinesville, GA 31313
Estimated Value: $77,000 - $155,000
2
Beds
1
Bath
964
Sq Ft
$125/Sq Ft
Est. Value
About This Home
This home is located at 650 Tupelo Trail Unit 2A, Hinesville, GA 31313 and is currently estimated at $120,044, approximately $124 per square foot. 650 Tupelo Trail Unit 2A is a home located in Liberty County with nearby schools including Joseph Martin Elementary School, Midway Middle School, and Liberty County High School.
Ownership History
Date
Name
Owned For
Owner Type
Purchase Details
Closed on
Jul 23, 2020
Sold by
Smiley David N
Bought by
Prosper Holdings Llc
Current Estimated Value
Purchase Details
Closed on
Apr 20, 2020
Sold by
Prosper Holdings Llc
Bought by
Smiley David N
Purchase Details
Closed on
Sep 21, 2012
Sold by
Brown Allen
Bought by
Brown Allen and Jones Billy N
Purchase Details
Closed on
May 9, 2008
Sold by
Faith Contracting & Construction Inc
Bought by
Prosper Holding Llc
Purchase Details
Closed on
Mar 20, 2007
Sold by
Southern Rental Investments
Bought by
Faith Contracting & Construction Inc
Purchase Details
Closed on
Jun 23, 2003
Sold by
Blecha James R
Bought by
Southern Rental Investments
Purchase Details
Closed on
May 23, 1997
Sold by
Blanco Edwin
Bought by
Blecha James R
Purchase Details
Closed on
Nov 21, 1994
Bought by
Blanco Edwin
Purchase Details
Closed on
Jul 1, 1988
Bought by
Austin Valerie R
Create a Home Valuation Report for This Property
The Home Valuation Report is an in-depth analysis detailing your home's value as well as a comparison with similar homes in the area
Home Values in the Area
Average Home Value in this Area
Purchase History
| Date | Buyer | Sale Price | Title Company |
|---|---|---|---|
| Prosper Holdings Llc | $128,000 | -- | |
| Smiley David N | -- | -- | |
| Brown Allen | -- | -- | |
| Prosper Holding Llc | -- | -- | |
| Faith Contracting & Construction Inc | $455,000 | -- | |
| Southern Rental Investments | $23,000 | -- | |
| Blecha James R | -- | -- | |
| Blanco Edwin | $30,200 | -- | |
| Austin Valerie R | $36,800 | -- |
Source: Public Records
Tax History Compared to Growth
Tax History
| Year | Tax Paid | Tax Assessment Tax Assessment Total Assessment is a certain percentage of the fair market value that is determined by local assessors to be the total taxable value of land and additions on the property. | Land | Improvement |
|---|---|---|---|---|
| 2024 | $1,022 | $20,454 | $1,400 | $19,054 |
| 2023 | $1,022 | $15,375 | $1,400 | $13,975 |
| 2022 | $608 | $12,696 | $1,400 | $11,296 |
| 2021 | $566 | $11,566 | $1,400 | $10,166 |
| 2020 | $578 | $11,713 | $1,400 | $10,313 |
| 2019 | $580 | $11,860 | $1,400 | $10,460 |
| 2018 | $584 | $12,008 | $1,400 | $10,608 |
| 2017 | $438 | $13,313 | $1,400 | $11,913 |
| 2016 | $616 | $13,313 | $1,400 | $11,913 |
| 2015 | $652 | $13,313 | $1,400 | $11,913 |
| 2014 | $652 | $13,969 | $1,400 | $12,569 |
| 2013 | -- | $14,826 | $1,400 | $13,426 |
Source: Public Records
Map
Nearby Homes
- 650 Tupelo Trail Unit 1C
- 650 Tupelo Trail Unit 7C
- 650 Tupelo Trail Unit 3B
- 650 Tupelo Trail Unit 7A
- 650 Tupelo Trail Unit 5A
- 650 Tupelo Trail Unit 1B
- 650 Tupelo Trail Unit 6B
- 650 Tupelo Trail Unit 5-B
- 650 Tupelo Trail Unit 2C
- 650 Tupelo Trail Unit 8
- 650 Tupelo Trail Unit 6A
- 650 Tupelo Trail
- 650 Tupelo Trail
- 650 Tupelo Trail Unit 1A
- 650 Tupelo Trail Unit 7B
- 650 Tupelo Trail Unit 5B
- Unit 1A Tupelo Trail
- 622 Palmetto Trace
- 624 Palmetto Trace
- 620 Palmetto Trace