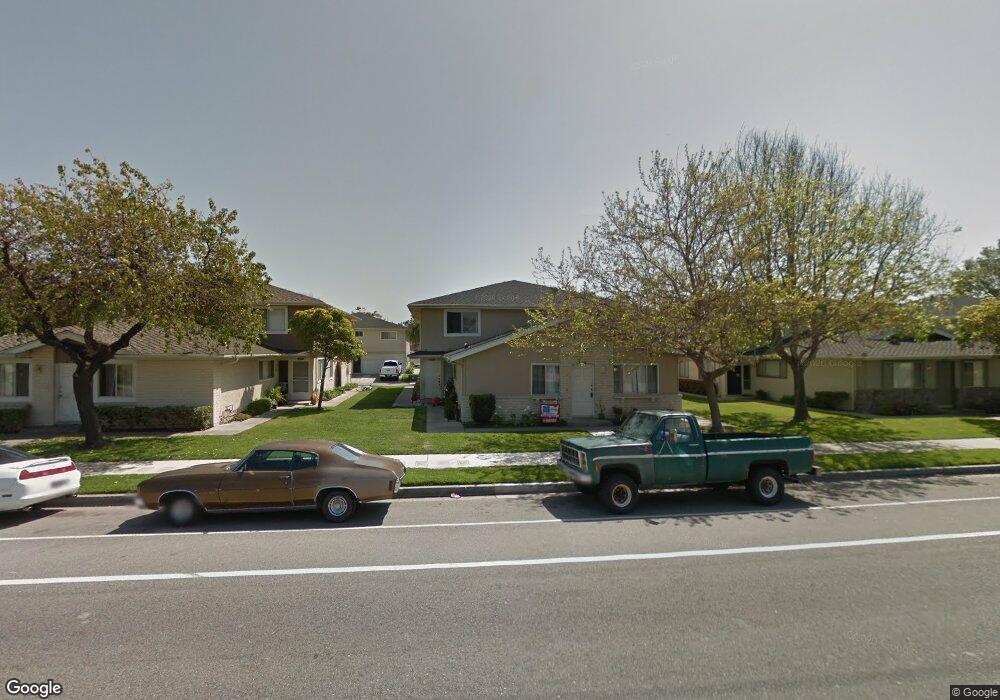
650 W Hemlock St Port Hueneme, CA 93041
Estimated Value: $367,000 - $466,000
2
Beds
1
Bath
806
Sq Ft
$499/Sq Ft
Est. Value
About This Home
This home is located at 650 W Hemlock St, Port Hueneme, CA 93041 and is currently estimated at $402,523, approximately $499 per square foot. 650 W Hemlock St is a home located in Ventura County with nearby schools including Marina West Elementary School and Oxnard High School.
Ownership History
Date
Name
Owned For
Owner Type
Purchase Details
Closed on
Oct 11, 2016
Sold by
Benko Tom
Bought by
Benko Thomas J
Current Estimated Value
Purchase Details
Closed on
Nov 17, 2011
Sold by
Reyes Lydia G
Bought by
Benko Tom
Home Financials for this Owner
Home Financials are based on the most recent Mortgage that was taken out on this home.
Original Mortgage
$70,000
Interest Rate
3.98%
Mortgage Type
Purchase Money Mortgage
Purchase Details
Closed on
Aug 31, 1999
Sold by
Parades Rogelio Leticia
Bought by
Reyes Lydia G
Home Financials for this Owner
Home Financials are based on the most recent Mortgage that was taken out on this home.
Original Mortgage
$74,700
Interest Rate
7.97%
Purchase Details
Closed on
Jul 13, 1994
Sold by
Larsen Douglas G and Triche Dawn
Bought by
Paredes Rogelio and Paredes Leticia
Home Financials for this Owner
Home Financials are based on the most recent Mortgage that was taken out on this home.
Original Mortgage
$54,400
Interest Rate
5.2%
Create a Home Valuation Report for This Property
The Home Valuation Report is an in-depth analysis detailing your home's value as well as a comparison with similar homes in the area
Home Values in the Area
Average Home Value in this Area
Purchase History
| Date | Buyer | Sale Price | Title Company |
|---|---|---|---|
| Benko Thomas J | -- | None Available | |
| Benko Tom | $100,000 | Lawyers Title | |
| Reyes Lydia G | $83,000 | Lawyers Title | |
| Paredes Rogelio | $68,000 | Chicago Title Co |
Source: Public Records
Mortgage History
| Date | Status | Borrower | Loan Amount |
|---|---|---|---|
| Previous Owner | Benko Tom | $70,000 | |
| Previous Owner | Reyes Lydia G | $74,700 | |
| Previous Owner | Paredes Rogelio | $54,400 | |
| Closed | Reyes Lydia G | $4,150 |
Source: Public Records
Tax History Compared to Growth
Tax History
| Year | Tax Paid | Tax Assessment Tax Assessment Total Assessment is a certain percentage of the fair market value that is determined by local assessors to be the total taxable value of land and additions on the property. | Land | Improvement |
|---|---|---|---|---|
| 2025 | $1,575 | $125,588 | $62,794 | $62,794 |
| 2024 | $1,575 | $123,126 | $61,563 | $61,563 |
| 2023 | $1,533 | $120,712 | $60,356 | $60,356 |
| 2022 | $1,479 | $118,346 | $59,173 | $59,173 |
| 2021 | $1,450 | $116,026 | $58,013 | $58,013 |
| 2020 | $1,434 | $114,838 | $57,419 | $57,419 |
| 2019 | $1,417 | $112,588 | $56,294 | $56,294 |
| 2018 | $1,404 | $110,382 | $55,191 | $55,191 |
| 2017 | $1,330 | $108,218 | $54,109 | $54,109 |
| 2016 | $1,308 | $106,098 | $53,049 | $53,049 |
| 2015 | $1,273 | $104,506 | $52,253 | $52,253 |
| 2014 | $1,270 | $102,462 | $51,231 | $51,231 |
Source: Public Records
Map
Nearby Homes
- 2633 Barnacle Cove
- 701 Halyard St
- 3644 Islander Walk
- 2692 Anchor Ave Unit 2
- 676 Pacific Cove Dr
- 469 Corvette St
- 541 Broderick Way
- 2622 Captains Ave
- 422 Las Palomas Dr
- 438 Las Palomas Dr
- 2014 Napoli Dr
- 2230 Monaco Dr
- 426 Reed Way
- 2141 Napoli Dr
- 3630 Miramar Way
- 3960 W Hemlock St
- 2110 Ravoli Dr
- 2524 Monaco Dr
- 4000 Romany Dr
- 1523 Windshore Way
- 648 W Hemlock St
- 652 W Hemlock St
- 654 W Hemlock St Unit 4
- 654 W Hemlock St
- 646 W Hemlock St
- 644 W Hemlock St
- 660 W Hemlock St
- 660 Hemlock St W
- 642 W Hemlock St
- 660 W Hemlock St
- 640 W Hemlock St
- 658 W Hemlock St
- 662 W Hemlock St Unit 3
- 636 W Hemlock St Unit 2
- 636 W Hemlock St
- 664 W Hemlock St
- 634 W Hemlock St
- 638 W Hemlock St
- 638 W Hemlock St
- 666 W Hemlock St