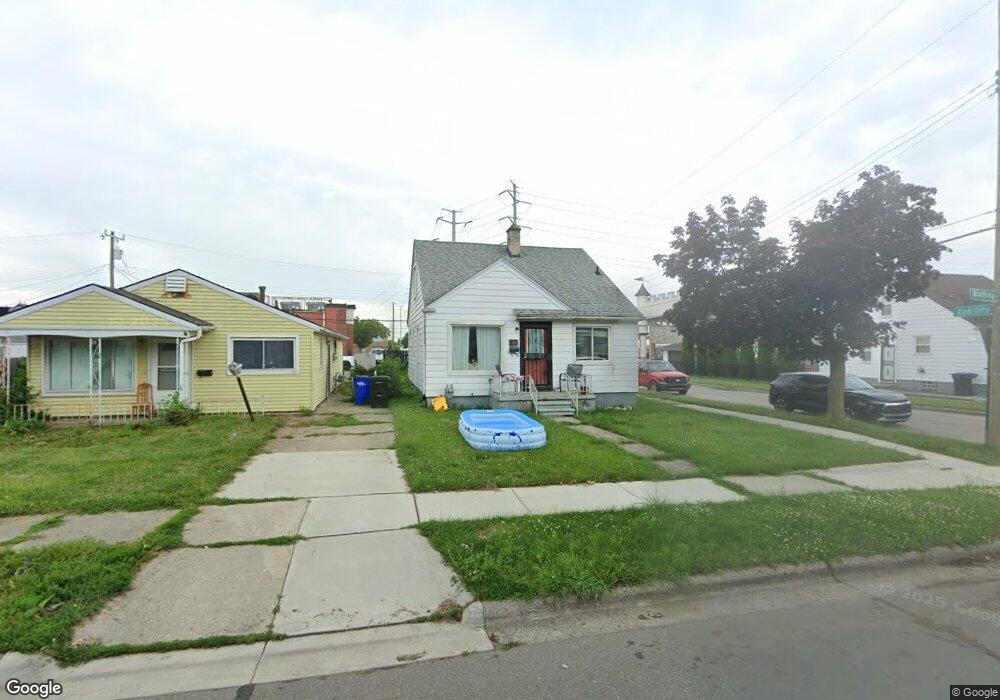
6500 Winthrop St Detroit, MI 48228
Warren Avenue Community NeighborhoodEstimated Value: $70,000 - $127,000
3
Beds
1
Bath
1,100
Sq Ft
$93/Sq Ft
Est. Value
About This Home
This home is located at 6500 Winthrop St, Detroit, MI 48228 and is currently estimated at $101,762, approximately $92 per square foot. 6500 Winthrop St is a home located in Wayne County with nearby schools including Gardner Elementary School, Charles L. Spain Elementary-Middle School, and Edward 'Duke' Ellington Conservatory of Music and Art.
Ownership History
Date
Name
Owned For
Owner Type
Purchase Details
Closed on
Mar 15, 2021
Sold by
Saa Management Llc
Bought by
Ahmad Nayef Mohamad
Current Estimated Value
Purchase Details
Closed on
Aug 26, 2020
Sold by
Ahamd Ahmad M
Bought by
S A A Management Llc
Purchase Details
Closed on
Oct 22, 2019
Sold by
Aldhulaimi Mosed
Bought by
Ahamd Ahmad Mohamad
Purchase Details
Closed on
Nov 7, 2013
Sold by
Wayne County Treasurer
Bought by
Aldhulaimi Mosed
Purchase Details
Closed on
Sep 4, 2008
Sold by
Busby Reginald and Busby Kristy
Bought by
Dagher Yoseph H
Purchase Details
Closed on
Oct 30, 2007
Sold by
Busby Reginald and Busby Kristy
Bought by
Ccb Properties Llc
Purchase Details
Closed on
Dec 13, 2006
Sold by
Palmer Property Llc
Bought by
Busby Reginald
Purchase Details
Closed on
Feb 16, 2006
Sold by
Carpenter Ricky
Bought by
U S Bank Na and The Csfb Mortgage Pass Through Certifica
Purchase Details
Closed on
Jul 6, 2001
Sold by
Carpenter Dorothy
Bought by
Carpenter Rick
Create a Home Valuation Report for This Property
The Home Valuation Report is an in-depth analysis detailing your home's value as well as a comparison with similar homes in the area
Home Values in the Area
Average Home Value in this Area
Purchase History
| Date | Buyer | Sale Price | Title Company |
|---|---|---|---|
| Ahmad Nayef Mohamad | -- | None Available | |
| S A A Management Llc | -- | None Listed On Document | |
| Ahamd Ahmad Mohamad | $65,000 | None Available | |
| Aldhulaimi Mosed | $6,500 | None Available | |
| Dagher Yoseph H | $14,900 | Title One Inc | |
| Ccb Properties Llc | -- | None Available | |
| Busby Reginald | $105,000 | Multiple | |
| U S Bank Na | $82,976 | None Available | |
| Carpenter Rick | -- | -- |
Source: Public Records
Tax History Compared to Growth
Tax History
| Year | Tax Paid | Tax Assessment Tax Assessment Total Assessment is a certain percentage of the fair market value that is determined by local assessors to be the total taxable value of land and additions on the property. | Land | Improvement |
|---|---|---|---|---|
| 2025 | $1,555 | $36,300 | $0 | $0 |
| 2024 | $1,555 | $30,200 | $0 | $0 |
| 2023 | $1,510 | $24,000 | $0 | $0 |
| 2022 | $1,613 | $21,400 | $0 | $0 |
| 2021 | $1,568 | $16,900 | $0 | $0 |
| 2020 | $1,567 | $15,000 | $0 | $0 |
| 2019 | $1,184 | $12,200 | $0 | $0 |
| 2018 | $1,042 | $11,300 | $0 | $0 |
| 2017 | $193 | $10,200 | $0 | $0 |
| 2016 | $1,557 | $17,400 | $0 | $0 |
| 2015 | $1,485 | $17,400 | $0 | $0 |
| 2013 | $1,439 | $24,445 | $0 | $0 |
| 2010 | -- | $35,026 | $662 | $34,364 |
Source: Public Records
Map
Nearby Homes
- 6578 Montrose St
- 6404 Yinger Ave
- 6934 Coleman St
- 6406 Payne Ave
- 7410 Barrie St
- 6320 Saint Marys St
- 7019 Barrie St
- 6932 Mead St
- 5530 Mead St
- 7115 Payne Ave
- 7115 Steadman St
- 7120 Ternes
- 7309 Payne Ave
- 6410 Orchard Ave
- 6345 Woodmont Ave
- 6344 Grandmont Ave
- 7309 Ternes
- 6857 Woodmont Ave
- 7519 Barrie St
- 7337 Saint Marys St
- 6510 Winthrop St
- 6516 Winthrop St
- 6412 Winthrop St
- 6524 Winthrop St
- 6501 Greenfield Rd
- 3 Woodbridge Ct. Greenfield Rd Rd
- 6530 Winthrop St
- 6531 Greenfield Rd
- 6503 Winthrop St
- 6511 Winthrop St
- 6517 Winthrop St
- 6544 Winthrop St
- 6386 Winthrop St
- 6531 Winthrop St
- 6391 Winthrop St
- 6539 Winthrop St
- 6413 Winthrop St
- 6525 Winthrop St
- 6405 Winthrop St
- 6558 Winthrop St