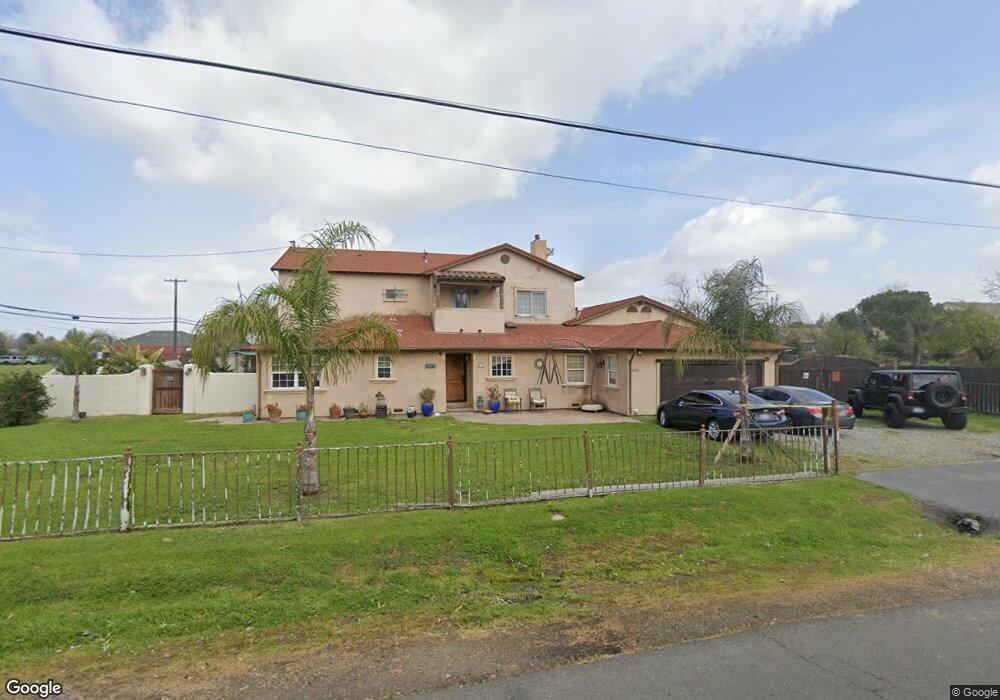
6501 Pomegranate Ave Sacramento, CA 95823
Estimated Value: $460,000 - $958,597
5
Beds
4
Baths
6,266
Sq Ft
$114/Sq Ft
Est. Value
About This Home
This home is located at 6501 Pomegranate Ave, Sacramento, CA 95823 and is currently estimated at $711,199, approximately $113 per square foot. 6501 Pomegranate Ave is a home located in Sacramento County with nearby schools including David Reese Elementary School, James Rutter Middle School, and Florin High School.
Ownership History
Date
Name
Owned For
Owner Type
Purchase Details
Closed on
Oct 27, 2003
Sold by
Deguzman Marciana and Deguzman Alberto N
Bought by
Tapia Elroy and Tapia Veronica
Current Estimated Value
Home Financials for this Owner
Home Financials are based on the most recent Mortgage that was taken out on this home.
Original Mortgage
$220,000
Interest Rate
6.5%
Mortgage Type
Unknown
Purchase Details
Closed on
Sep 19, 2002
Sold by
The Dooda Limited Partnership
Bought by
Deguzman Marciana and Deguzman Alberto N
Home Financials for this Owner
Home Financials are based on the most recent Mortgage that was taken out on this home.
Original Mortgage
$70,000
Interest Rate
6.24%
Mortgage Type
Seller Take Back
Purchase Details
Closed on
Sep 11, 2000
Sold by
Rice Jack & Tr
Bought by
Dooda Ltd Partnership
Purchase Details
Closed on
May 6, 1994
Sold by
Bec Trust Deed Services Inc
Bought by
Stewart Olivia Irma
Create a Home Valuation Report for This Property
The Home Valuation Report is an in-depth analysis detailing your home's value as well as a comparison with similar homes in the area
Home Values in the Area
Average Home Value in this Area
Purchase History
| Date | Buyer | Sale Price | Title Company |
|---|---|---|---|
| Tapia Elroy | $300,000 | Commonwealth Land Title Co | |
| Deguzman Marciana | $120,000 | North American Title Co | |
| Dooda Ltd Partnership | -- | -- | |
| Dooda Ltd Partnership | -- | -- | |
| Rice Jack | -- | -- | |
| Stewart Olivia Irma | $68,562 | -- |
Source: Public Records
Mortgage History
| Date | Status | Borrower | Loan Amount |
|---|---|---|---|
| Previous Owner | Tapia Elroy | $220,000 | |
| Previous Owner | Deguzman Marciana | $70,000 |
Source: Public Records
Tax History Compared to Growth
Tax History
| Year | Tax Paid | Tax Assessment Tax Assessment Total Assessment is a certain percentage of the fair market value that is determined by local assessors to be the total taxable value of land and additions on the property. | Land | Improvement |
|---|---|---|---|---|
| 2025 | $7,209 | $761,670 | $284,348 | $477,322 |
| 2024 | $7,209 | $659,089 | $278,773 | $380,316 |
| 2023 | $6,681 | $616,755 | $273,307 | $343,448 |
| 2022 | $6,626 | $604,663 | $267,949 | $336,714 |
| 2021 | $6,514 | $592,808 | $262,696 | $330,112 |
| 2020 | $6,410 | $586,731 | $260,003 | $326,728 |
| 2019 | $6,287 | $575,227 | $254,905 | $320,322 |
| 2018 | $6,112 | $563,949 | $249,907 | $314,042 |
| 2017 | $5,983 | $552,892 | $245,007 | $307,885 |
| 2016 | $5,683 | $542,052 | $240,203 | $301,849 |
| 2015 | $5,360 | $520,121 | $236,595 | $283,526 |
| 2014 | $5,297 | $509,934 | $231,961 | $277,973 |
Source: Public Records
Map
Nearby Homes
- 6124 Pomegranate Ave
- 5906 Stacy Ave
- 7312 Del Prado Way
- 6400 66th Ave Unit 21
- 7700 La Mancha Way
- 7734 Whispering Palms Dr
- 7618 Sunvaught Ln
- 7206 Willowwest Ct
- 6104 Center Mall Way
- 7566 Sunmore Ln
- 7451 Albezzia Ln
- 5890 Tangerine Ave
- 7548 Huckleberry Ln
- 7100 Sunbridge Ln
- 7413 Skander Way
- 5837 Ambler St
- 63 Omaha Ct
- 7598 Sunmore Ln
- 7551 Red Bud Ln
- 6944 Mirador Way