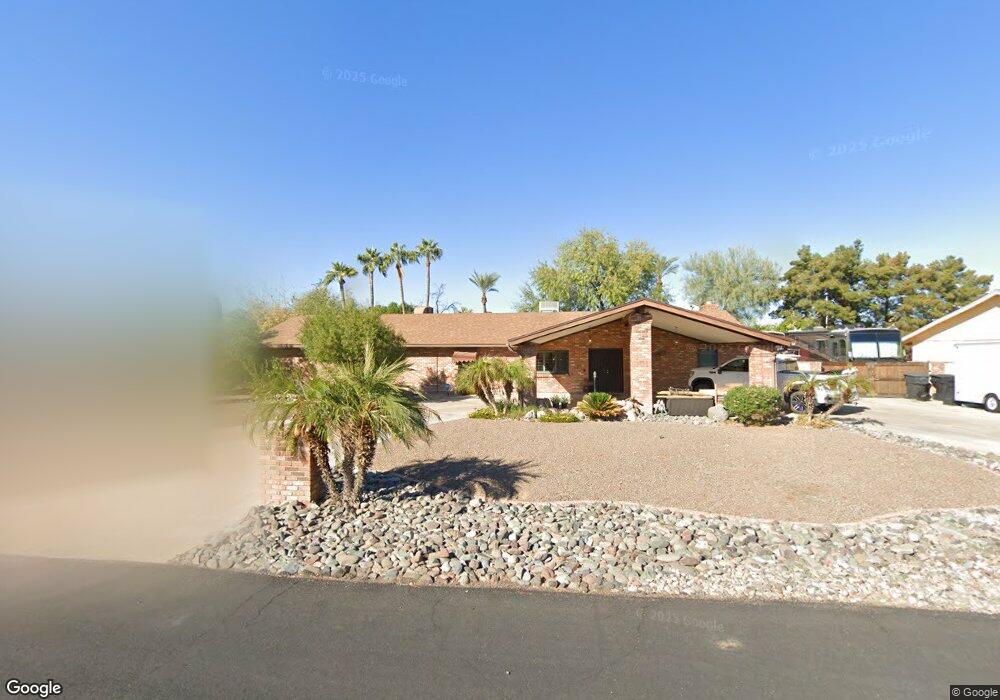
6502 W Villa Theresa Dr Glendale, AZ 85308
Arrowhead NeighborhoodEstimated Value: $615,411 - $759,000
--
Bed
3
Baths
2,560
Sq Ft
$266/Sq Ft
Est. Value
About This Home
This home is located at 6502 W Villa Theresa Dr, Glendale, AZ 85308 and is currently estimated at $681,103, approximately $266 per square foot. 6502 W Villa Theresa Dr is a home located in Maricopa County with nearby schools including Highland Lakes School, Greenbrier Elementary School, and Deer Valley High School.
Ownership History
Date
Name
Owned For
Owner Type
Purchase Details
Closed on
Dec 2, 2014
Sold by
Dregne Scott A and Dregne Lisa
Bought by
Dregne Scott and Dregne Lisa
Current Estimated Value
Home Financials for this Owner
Home Financials are based on the most recent Mortgage that was taken out on this home.
Original Mortgage
$120,000
Outstanding Balance
$92,190
Interest Rate
4%
Mortgage Type
Credit Line Revolving
Estimated Equity
$588,913
Purchase Details
Closed on
Aug 10, 1999
Sold by
Dregne Charlotte M
Bought by
Dregne Scott A
Purchase Details
Closed on
Nov 7, 1995
Sold by
Flener Jimmie D and Flener Glenna A
Bought by
Dregne Scott A and Dregne Charlotte M
Home Financials for this Owner
Home Financials are based on the most recent Mortgage that was taken out on this home.
Original Mortgage
$112,000
Interest Rate
7.47%
Mortgage Type
New Conventional
Create a Home Valuation Report for This Property
The Home Valuation Report is an in-depth analysis detailing your home's value as well as a comparison with similar homes in the area
Home Values in the Area
Average Home Value in this Area
Purchase History
| Date | Buyer | Sale Price | Title Company |
|---|---|---|---|
| Dregne Scott | -- | Fidelity Natl Title Agency | |
| Dregne Scott A | -- | -- | |
| Dregne Scott A | $140,000 | United Title Agency |
Source: Public Records
Mortgage History
| Date | Status | Borrower | Loan Amount |
|---|---|---|---|
| Open | Dregne Scott | $120,000 | |
| Closed | Dregne Scott A | $112,000 |
Source: Public Records
Tax History Compared to Growth
Tax History
| Year | Tax Paid | Tax Assessment Tax Assessment Total Assessment is a certain percentage of the fair market value that is determined by local assessors to be the total taxable value of land and additions on the property. | Land | Improvement |
|---|---|---|---|---|
| 2025 | $2,782 | $34,467 | -- | -- |
| 2024 | $2,749 | $32,826 | -- | -- |
| 2023 | $2,749 | $50,430 | $10,080 | $40,350 |
| 2022 | $2,676 | $40,600 | $8,120 | $32,480 |
| 2021 | $2,822 | $37,380 | $7,470 | $29,910 |
| 2020 | $2,791 | $33,300 | $6,660 | $26,640 |
| 2019 | $2,721 | $32,010 | $6,400 | $25,610 |
| 2018 | $2,654 | $30,900 | $6,180 | $24,720 |
| 2017 | $2,582 | $27,750 | $5,550 | $22,200 |
| 2016 | $2,450 | $28,330 | $5,660 | $22,670 |
| 2015 | $2,271 | $26,830 | $5,360 | $21,470 |
Source: Public Records
Map
Nearby Homes
- 18242 N 66th Ave
- 6729 W Villa Theresa Dr
- 18161 N 63rd Ln
- 18222 N 63rd Ave
- 6340 W Grovers Ave
- 6132 W Michigan Ave
- 6149 W Wagoner Rd
- 6531 W Schmidt St
- 18874 N 69th Ave
- 6361 W Grovers Ave
- 17790 N 66th Ln
- 6389 W Muriel Dr
- 18585 N 70th Ave
- 17770 N 66th Ln
- 17445 N 64th Dr
- 17719 N 67th Ln
- 6017 W Villa Maria Dr
- 18666 N 70th Dr
- 7056 W Morrow Dr
- 7102 W Julie Dr
- 6422 W Villa Theresa Dr
- 6516 W Villa Theresa Dr
- 6503 W Villa Theresa Dr
- 6503 W Villa Theresa Dr
- 6423 W Villa Theresa Dr
- 6526 W Villa Theresa Dr
- 6515 W Villa Theresa Dr
- 6413 W Villa Theresa Dr
- 6525 W Villa Theresa Dr
- 6432 W Wagoner Rd
- 6502 W Wagoner Rd
- 6616 W Villa Theresa Dr
- 6402 W Villa Theresa Dr
- 6422 W Wagoner Rd
- 6522 W Wagoner Rd
- 6401 W Villa Theresa Dr
- 6615 W Villa Theresa Dr
- 6606 W Wagoner Rd
- 6626 W Villa Theresa Dr
- 6402 W Wagoner Rd