6503 N Ashland Ave Unit 1 Chicago, IL 60626
Rogers Park NeighborhoodEstimated Value: $164,000 - $259,000
3
Beds
1
Bath
900
Sq Ft
$248/Sq Ft
Est. Value
About This Home
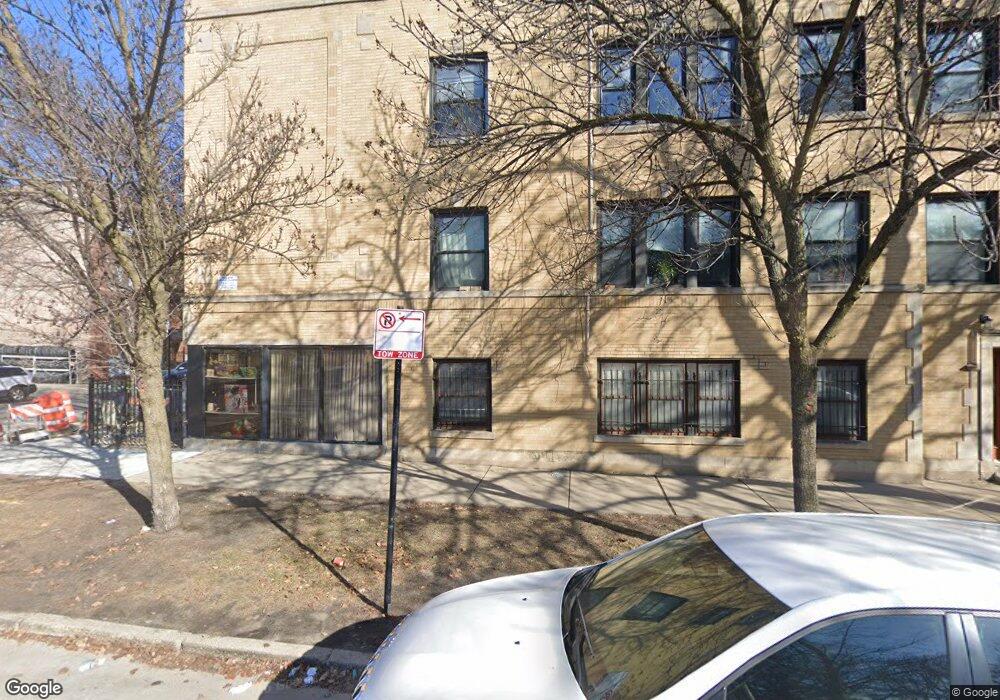
This home is located at 6503 N Ashland Ave Unit 1, Chicago, IL 60626 and is currently estimated at $222,832, approximately $247 per square foot. 6503 N Ashland Ave Unit 1 is a home located in Cook County with nearby schools including Kilmer Elementary School, Sullivan High School, and Chicago Math and Science Academy.
Ownership History
Date
Name
Owned For
Owner Type
Purchase Details
Closed on
Sep 29, 2014
Sold by
1548 W Arthur Condominium Association
Bought by
Arthur Ashland Llc
Current Estimated Value
Home Financials for this Owner
Home Financials are based on the most recent Mortgage that was taken out on this home.
Original Mortgage
$1,170,000
Interest Rate
4.08%
Mortgage Type
Purchase Money Mortgage
Purchase Details
Closed on
Sep 21, 2012
Sold by
Alex Turik
Bought by
Mast Financial Group Llc
Purchase Details
Closed on
Jan 31, 2012
Sold by
Federal Home Loan Mortgage Corporation
Bought by
Turik Alex
Purchase Details
Closed on
Nov 9, 2011
Sold by
Muresan Marius L
Bought by
Federal Home Loan Mortgage Corporation
Purchase Details
Closed on
Feb 29, 2008
Sold by
1548 W Arthur Llc
Bought by
Muresan Marius L
Home Financials for this Owner
Home Financials are based on the most recent Mortgage that was taken out on this home.
Original Mortgage
$234,000
Interest Rate
5.75%
Mortgage Type
Purchase Money Mortgage
Create a Home Valuation Report for This Property
The Home Valuation Report is an in-depth analysis detailing your home's value as well as a comparison with similar homes in the area
Home Values in the Area
Average Home Value in this Area
Purchase History
| Date | Buyer | Sale Price | Title Company |
|---|---|---|---|
| Arthur Ashland Llc | -- | None Available | |
| Mast Financial Group Llc | -- | None Available | |
| Turik Alex | $43,000 | Atgf Inc | |
| Federal Home Loan Mortgage Corporation | -- | None Available | |
| Muresan Marius L | $260,000 | Pntn |
Source: Public Records
Mortgage History
| Date | Status | Borrower | Loan Amount |
|---|---|---|---|
| Closed | Arthur Ashland Llc | $1,170,000 | |
| Previous Owner | Muresan Marius L | $234,000 |
Source: Public Records
Tax History Compared to Growth
Tax History
| Year | Tax Paid | Tax Assessment Tax Assessment Total Assessment is a certain percentage of the fair market value that is determined by local assessors to be the total taxable value of land and additions on the property. | Land | Improvement |
|---|---|---|---|---|
| 2024 | $3,651 | $14,630 | $1,079 | $13,551 |
| 2023 | $3,559 | $17,304 | $863 | $16,441 |
| 2022 | $3,559 | $17,304 | $863 | $16,441 |
| 2021 | $3,382 | $16,818 | $863 | $15,955 |
| 2020 | $1,015 | $4,555 | $695 | $3,860 |
| 2019 | $1,020 | $5,078 | $695 | $4,383 |
| 2018 | $1,003 | $5,078 | $695 | $4,383 |
| 2017 | $1,114 | $5,175 | $623 | $4,552 |
| 2016 | $1,037 | $5,175 | $623 | $4,552 |
| 2015 | $948 | $5,175 | $623 | $4,552 |
| 2014 | $1,482 | $7,989 | $575 | $7,414 |
| 2013 | $1,453 | $7,989 | $575 | $7,414 |
Source: Public Records
Map
Nearby Homes
- 6532 N Ashland Ave
- 6628 N Bosworth Ave
- 1435 W Arthur Ave Unit 1
- 6414 N Paulina St Unit G
- 6646 N Ashland Ave Unit 3
- 1703 W Wallen Ave Unit 3C
- 1542 W Highland Ave
- 1626 W Highland Ave Unit 1W
- 1513 W Highland Ave
- 6447 N Glenwood Ave
- 1627 W Columbia Ave Unit GW
- 6729 N Ashland Ave
- 1742 W Wallen Ave
- 1745 W North Shore Ave
- 1749 W North Shore Ave
- 6738 N Bosworth Ave Unit 1W
- 1336 W Albion Ave Unit 2E
- 1630 W Columbia Ave Unit GN
- 1762 W Highland Ave Unit 104
- 6712 N Glenwood Ave Unit 2
- 6505 N Ashland Ave Unit 2
- 6505 N Ashland Ave Unit G
- 6505 N Ashland Ave Unit 65051
- 6505 N Ashland Ave Unit 3
- 6505 N Ashland Ave Unit 1
- 6503 N Ashland Ave Unit 3
- 6503 N Ashland Ave Unit 2
- 6509 N Ashland Ave
- 1548 W Arthur Ave Unit 15482
- 1548 W Arthur Ave Unit 15481
- 1550 W Arthur Ave Unit 1
- 1550 W Arthur Ave Unit 3
- 1548 W Arthur Ave Unit 15483
- 1550 W Arthur Ave Unit 2
- 1548 W Arthur Ave Unit 1552G
- 6501 N Ashland Ave
- 1548 W Arthur Ave Unit 2
- 1548 W Arthur Ave Unit 3
- 1548 W Arthur Ave Unit 1
- 6511 N Ashland Ave