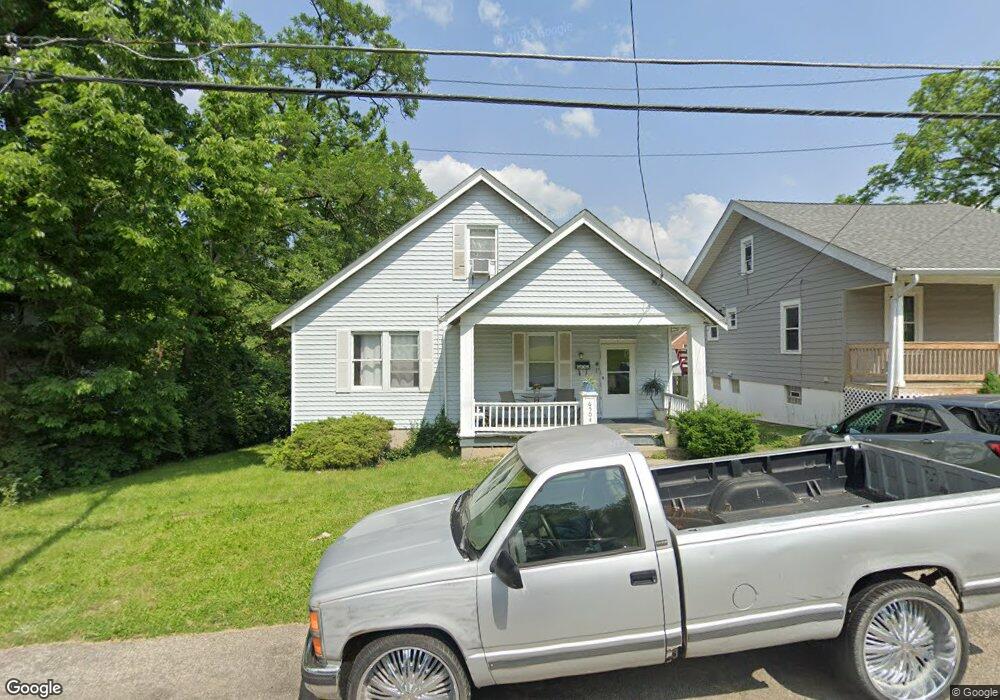
6504 Coleridge Ave Cincinnati, OH 45213
Kennedy Heights NeighborhoodEstimated Value: $177,000 - $264,000
4
Beds
1
Bath
1,912
Sq Ft
$118/Sq Ft
Est. Value
About This Home
This home is located at 6504 Coleridge Ave, Cincinnati, OH 45213 and is currently estimated at $225,550, approximately $117 per square foot. 6504 Coleridge Ave is a home located in Hamilton County with nearby schools including John P. Parker School, Shroder High School, and Clark Montessori High School.
Ownership History
Date
Name
Owned For
Owner Type
Purchase Details
Closed on
Jun 13, 2018
Sold by
Miller Elissa K
Bought by
Vbannex C Ohio Llc
Current Estimated Value
Purchase Details
Closed on
Oct 14, 2016
Sold by
Davis Steven and Davis Pamela
Bought by
Miller Elissa K
Home Financials for this Owner
Home Financials are based on the most recent Mortgage that was taken out on this home.
Original Mortgage
$47,000
Interest Rate
3.44%
Mortgage Type
Purchase Money Mortgage
Purchase Details
Closed on
Sep 4, 2009
Sold by
Fannie Mae
Bought by
Davis Steven and Davis Pamela
Purchase Details
Closed on
Dec 23, 2008
Sold by
Lawson Abrahm J and Lawson Abraham
Bought by
Federal National Mortgage Association
Purchase Details
Closed on
Nov 28, 2001
Sold by
Hud
Bought by
Lawson Abraham
Home Financials for this Owner
Home Financials are based on the most recent Mortgage that was taken out on this home.
Original Mortgage
$56,287
Interest Rate
6.53%
Purchase Details
Closed on
Jun 11, 2001
Sold by
Morse Gwendolyn C and Morse John
Bought by
Hud
Create a Home Valuation Report for This Property
The Home Valuation Report is an in-depth analysis detailing your home's value as well as a comparison with similar homes in the area
Home Values in the Area
Average Home Value in this Area
Purchase History
| Date | Buyer | Sale Price | Title Company |
|---|---|---|---|
| Vbannex C Ohio Llc | $71,800 | None Available | |
| Miller Elissa K | $27,500 | -- | |
| Davis Steven | $22,300 | None Available | |
| Federal National Mortgage Association | $50,000 | None Available | |
| Lawson Abraham | $59,250 | Prodigy Title Agency Inc | |
| Hud | $50,000 | -- |
Source: Public Records
Mortgage History
| Date | Status | Borrower | Loan Amount |
|---|---|---|---|
| Previous Owner | Miller Elissa K | $47,000 | |
| Previous Owner | Lawson Abraham | $56,287 |
Source: Public Records
Tax History
| Year | Tax Paid | Tax Assessment Tax Assessment Total Assessment is a certain percentage of the fair market value that is determined by local assessors to be the total taxable value of land and additions on the property. | Land | Improvement |
|---|---|---|---|---|
| 2025 | $2,798 | $43,852 | $10,763 | $33,089 |
| 2024 | $2,794 | $43,852 | $10,763 | $33,089 |
| 2023 | $2,799 | $43,852 | $10,763 | $33,089 |
| 2022 | $1,792 | $25,130 | $9,730 | $15,400 |
| 2021 | $1,755 | $25,130 | $9,730 | $15,400 |
| 2020 | $1,760 | $25,130 | $9,730 | $15,400 |
| 2019 | $1,400 | $18,155 | $8,610 | $9,545 |
| 2018 | $1,401 | $18,155 | $8,610 | $9,545 |
| 2017 | $1,348 | $18,155 | $8,610 | $9,545 |
| 2016 | $632 | $8,198 | $7,571 | $627 |
| 2015 | $567 | $8,198 | $7,571 | $627 |
| 2014 | $570 | $8,198 | $7,571 | $627 |
| 2013 | $552 | $7,805 | $7,210 | $595 |
Source: Public Records
Map
Nearby Homes
- 6501 Coleridge Ave
- 6508 Coleridge Ave
- 6460 Mchugh Place
- 3625 Zinsle Ave
- 3824 Standish Ave
- 3523 Mary Ann Ln
- 6218 Kennedy Ave
- 6221 Hedge Ave
- 6201 Kennedy Ave
- 3906 Standish Ave
- 6256 Rogers Park Place
- 3964 Zinsle Ave
- 6097 W Fordham Place
- 3566 Amberacres Dr
- 3962 S Fordham Place
- 6656 Plainfield Rd
- 3921 Cedarwood Place
- 6829 Alpine Ave
- 3946 Cedarwood Place
- 3521 Section Rd
- 6502 Coleridge Ave
- 3710 Kirkup Ave
- 3714 Kirkup Ave
- 3685 Kirkup Ave
- 3715 Odin Ave
- 3711 Odin Ave
- 3718 Kirkup Ave
- 6511 Coleridge Ave
- 6422 Coleridge Ave
- 6515 Coleridge Ave
- 3719 Odin Ave
- 6517 Coleridge Ave
- 6420 Coleridge Ave
- 6519 Coleridge Ave
- 6507 Coleridge Ave
- 3722 Kirkup Ave
- 6425 Coleridge Ave
- 3723 Odin Ave
- 6523 Coleridge Ave
- 3715 Kirkup Ave
Your Personal Tour Guide
Ask me questions while you tour the home.