Estimated Value: $872,420 - $925,000
4
Beds
4
Baths
2,174
Sq Ft
$416/Sq Ft
Est. Value
About This Home
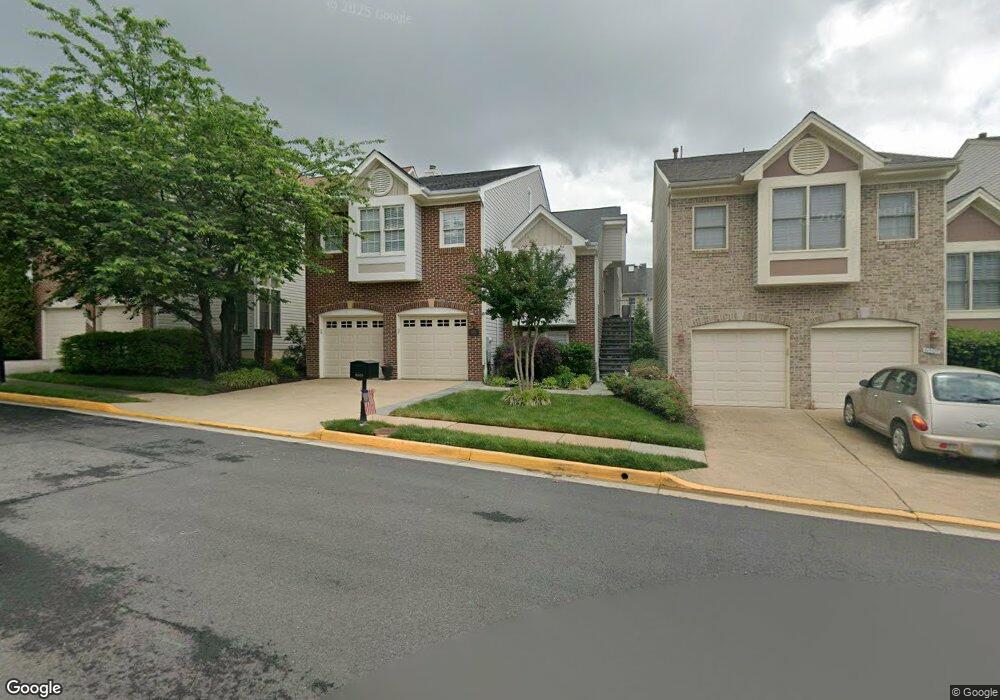
This home is located at 6505 Legendgate Place, Burke, VA 22015 and is currently estimated at $904,355, approximately $415 per square foot. 6505 Legendgate Place is a home located in Fairfax County with nearby schools including White Oaks Elementary School, Lake Braddock Secondary School, and Nativity Catholic School.
Ownership History
Date
Name
Owned For
Owner Type
Purchase Details
Closed on
Apr 28, 2016
Bought by
Kaminsky Mark J
Current Estimated Value
Home Financials for this Owner
Home Financials are based on the most recent Mortgage that was taken out on this home.
Original Mortgage
$465,500
Outstanding Balance
$370,570
Interest Rate
3.66%
Estimated Equity
$533,785
Purchase Details
Closed on
Feb 28, 1997
Sold by
Gulley + Nancy K
Bought by
Kaminsky Mark Jeffrey
Home Financials for this Owner
Home Financials are based on the most recent Mortgage that was taken out on this home.
Original Mortgage
$197,250
Interest Rate
7.78%
Mortgage Type
New Conventional
Purchase Details
Closed on
Aug 3, 1994
Sold by
Noble Homes Inc
Bought by
Gulley Nancy K
Home Financials for this Owner
Home Financials are based on the most recent Mortgage that was taken out on this home.
Original Mortgage
$167,000
Interest Rate
8.4%
Create a Home Valuation Report for This Property
The Home Valuation Report is an in-depth analysis detailing your home's value as well as a comparison with similar homes in the area
Home Values in the Area
Average Home Value in this Area
Purchase History
| Date | Buyer | Sale Price | Title Company |
|---|---|---|---|
| Kaminsky Mark J | -- | -- | |
| Kaminsky Mark Jeffrey | $263,000 | -- | |
| Gulley Nancy K | $269,794 | -- |
Source: Public Records
Mortgage History
| Date | Status | Borrower | Loan Amount |
|---|---|---|---|
| Open | Gulley Nancy K | $465,500 | |
| Closed | Gulley Nancy K | -- | |
| Previous Owner | Gulley Nancy K | $197,250 | |
| Previous Owner | Gulley Nancy K | $167,000 |
Source: Public Records
Tax History Compared to Growth
Tax History
| Year | Tax Paid | Tax Assessment Tax Assessment Total Assessment is a certain percentage of the fair market value that is determined by local assessors to be the total taxable value of land and additions on the property. | Land | Improvement |
|---|---|---|---|---|
| 2025 | $9,195 | $828,990 | $361,000 | $467,990 |
| 2024 | $9,195 | $793,730 | $334,000 | $459,730 |
| 2023 | $8,419 | $746,070 | $307,000 | $439,070 |
| 2022 | $7,956 | $695,750 | $285,000 | $410,750 |
| 2021 | $7,271 | $619,640 | $240,000 | $379,640 |
| 2020 | $6,892 | $582,360 | $222,000 | $360,360 |
| 2019 | $6,892 | $582,360 | $222,000 | $360,360 |
| 2018 | $6,680 | $580,870 | $222,000 | $358,870 |
| 2017 | $6,659 | $573,580 | $217,000 | $356,580 |
| 2016 | $6,085 | $525,260 | $208,000 | $317,260 |
| 2015 | $5,862 | $525,260 | $208,000 | $317,260 |
| 2014 | $5,949 | $534,260 | $217,000 | $317,260 |
Source: Public Records
Map
Nearby Homes
- 9462 Wooded Glen Ave
- 9405 William Kirk Ln
- 6312 Teakwood Ct
- 9616 Villagesmith Way
- 9472 Lapstrake Ln
- 9505 Scorpio Ln
- 6421 Spring Lake Dr
- 6314 Draco St
- 9175 Broken Oak Place Unit 39B
- 6281 Timarron Cove Ln
- 6311 Fenestra Ct Unit 137B
- 9427 Candleberry Ct
- 6214 Garretson St
- 9136 Oshad Ln
- 9403 Onion Patch Dr
- 9068 Blarney Stone Dr
- 6503 Field Master Dr
- 6207 Gemini Ct
- 6111 Wilmington Dr
- 6427 Old Scotts Ct
- 6507 Legendgate Place
- 6503 Legendgate Place
- 6509 Legendgate Place
- 9450 William Kirk Ln
- 9452 William Kirk Ln
- 9448 William Kirk Ln
- 9454 William Kirk Ln
- 6500 Legendgate Place
- 9456 William Kirk Ln
- 6511 Legendgate Place
- 9446 William Kirk Ln
- 9458 William Kirk Ln
- 6502 Legendgate Place
- 9444 William Kirk Ln
- 6513 Legendgate Place
- 9442 William Kirk Ln
- 6504 Legendgate Place
- 6508 Legendgate Place
- 6506 Legendgate Place
- 6510 Legendgate Place