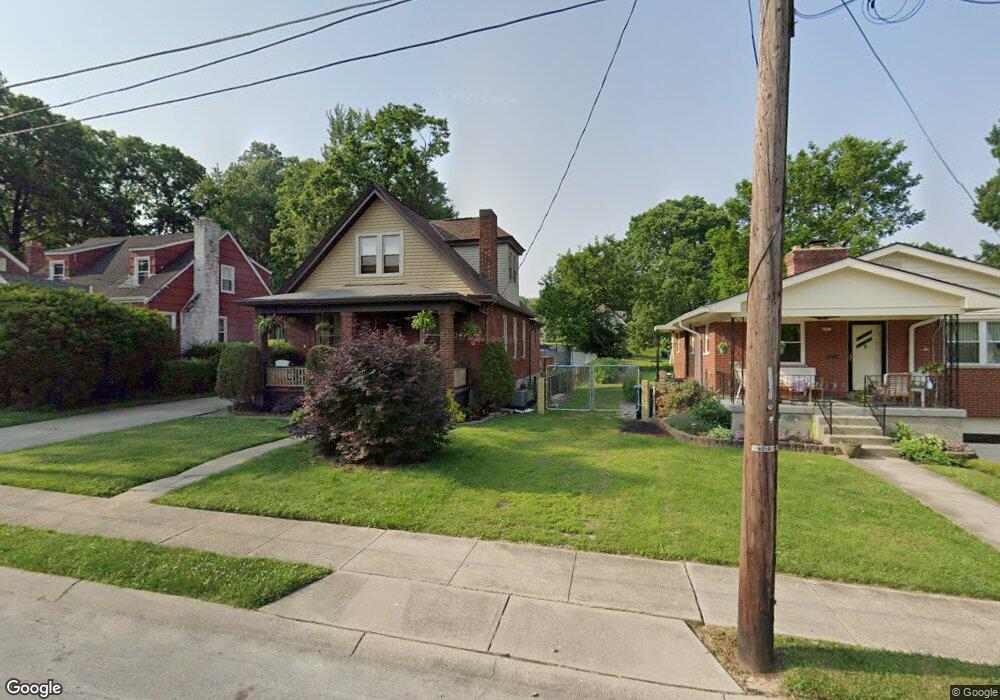
6505 Pace Ave Cincinnati, OH 45213
Kennedy Heights NeighborhoodEstimated Value: $169,000 - $351,000
2
Beds
2
Baths
1,313
Sq Ft
$212/Sq Ft
Est. Value
About This Home
This home is located at 6505 Pace Ave, Cincinnati, OH 45213 and is currently estimated at $278,591, approximately $212 per square foot. 6505 Pace Ave is a home located in Hamilton County with nearby schools including Pleasant Ridge Montessori School, Shroder High School, and Clark Montessori High School.
Ownership History
Date
Name
Owned For
Owner Type
Purchase Details
Closed on
Jul 14, 2017
Sold by
Williams Angie and Butler Lamont Andre
Bought by
Butler Angie
Current Estimated Value
Home Financials for this Owner
Home Financials are based on the most recent Mortgage that was taken out on this home.
Original Mortgage
$49,164
Outstanding Balance
$8,645
Interest Rate
3.89%
Mortgage Type
New Conventional
Estimated Equity
$269,946
Purchase Details
Closed on
Jul 9, 1998
Sold by
Freeman Helen and Schneider David
Bought by
Williams Angie
Purchase Details
Closed on
May 15, 1997
Sold by
Freeman Helen
Bought by
Freeman Helen
Purchase Details
Closed on
Aug 19, 1996
Sold by
Arnett Jack M and Arnett Nancy K
Bought by
Freeman Helen and Schneider David
Purchase Details
Closed on
Mar 22, 1995
Sold by
Arnett Jack
Bought by
Arnett Jack M and Arnett Nancy K
Create a Home Valuation Report for This Property
The Home Valuation Report is an in-depth analysis detailing your home's value as well as a comparison with similar homes in the area
Home Values in the Area
Average Home Value in this Area
Purchase History
| Date | Buyer | Sale Price | Title Company |
|---|---|---|---|
| Butler Angie | -- | Servicelink | |
| Williams Angie | $65,000 | -- | |
| Williams Angie | $65,000 | -- | |
| Freeman Helen | -- | -- | |
| Freeman Helen | $1,600 | -- | |
| Arnett Jack M | -- | -- |
Source: Public Records
Mortgage History
| Date | Status | Borrower | Loan Amount |
|---|---|---|---|
| Open | Butler Angie | $49,164 |
Source: Public Records
Tax History
| Year | Tax Paid | Tax Assessment Tax Assessment Total Assessment is a certain percentage of the fair market value that is determined by local assessors to be the total taxable value of land and additions on the property. | Land | Improvement |
|---|---|---|---|---|
| 2025 | $4,220 | $66,469 | $18,967 | $47,502 |
| 2024 | $4,214 | $66,469 | $18,967 | $47,502 |
| 2023 | $4,221 | $66,469 | $18,967 | $47,502 |
| 2022 | $3,231 | $45,725 | $11,316 | $34,409 |
| 2021 | $3,174 | $45,725 | $11,316 | $34,409 |
| 2020 | $3,183 | $45,725 | $11,316 | $34,409 |
| 2019 | $3,094 | $40,464 | $10,014 | $30,450 |
| 2018 | $3,096 | $40,464 | $10,014 | $30,450 |
| 2017 | $2,982 | $40,464 | $10,014 | $30,450 |
| 2016 | $2,831 | $37,461 | $9,615 | $27,846 |
| 2015 | $2,531 | $37,461 | $9,615 | $27,846 |
| 2014 | $2,544 | $37,461 | $9,615 | $27,846 |
| 2013 | $2,694 | $39,019 | $10,014 | $29,005 |
Source: Public Records
Map
Nearby Homes
- 6817 Withany Ave
- 6454 Crestview Ave
- 6470 Crestview Ave
- 6466 Crestview Ave
- 6462 Crestview Ave
- 6458 Crestview Ave
- 3533 Amberacres Dr
- 3521 Section Rd
- 6256 Rogers Park Place
- 3563 Amberacres Dr
- 3523 Mary Ann Ln
- 6460 Mchugh Place
- 3625 Zinsle Ave
- 6276 Grand Vista Ave
- 6501 Coleridge Ave
- 6508 Coleridge Ave
- 6201 Kennedy Ave
- 6207 Coleridge Ave
- 6140 Grand Vista Ave
- 3822 Odin Ave
Your Personal Tour Guide
Ask me questions while you tour the home.