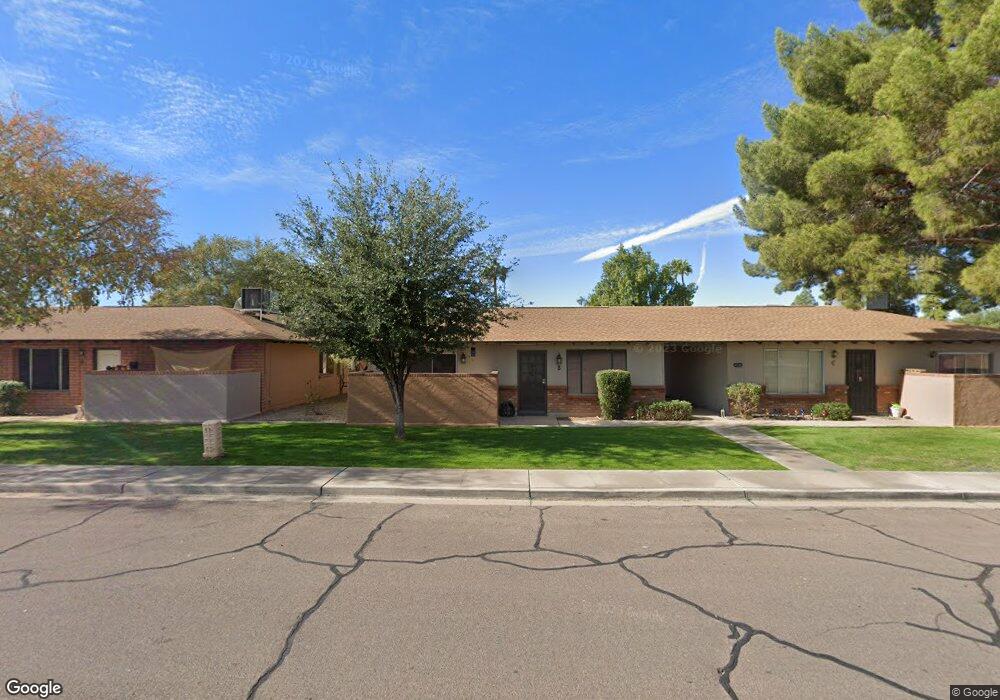
6505 S Newberry Rd Unit B Tempe, AZ 85283
South Tempe NeighborhoodEstimated Value: $234,057 - $283,000
--
Bed
1
Bath
858
Sq Ft
$309/Sq Ft
Est. Value
About This Home
This home is located at 6505 S Newberry Rd Unit B, Tempe, AZ 85283 and is currently estimated at $265,514, approximately $309 per square foot. 6505 S Newberry Rd Unit B is a home located in Maricopa County with nearby schools including Kyrene del Norte School, Kyrene de los Niños Elementary School, and Kyrene Middle School.
Ownership History
Date
Name
Owned For
Owner Type
Purchase Details
Closed on
Jun 20, 2012
Sold by
Koivula Lynda G
Bought by
Ridgway Alan L and Koivula Lynda G
Current Estimated Value
Purchase Details
Closed on
Oct 11, 2004
Sold by
Rauch James E and Rauch Kristina L
Bought by
Koivula Dennis and Koivula Lynda
Home Financials for this Owner
Home Financials are based on the most recent Mortgage that was taken out on this home.
Original Mortgage
$72,000
Outstanding Balance
$35,586
Interest Rate
5.74%
Mortgage Type
New Conventional
Estimated Equity
$229,928
Purchase Details
Closed on
Aug 5, 1997
Sold by
Dietz Helen L
Bought by
Rauch James E and Rauch Kristina L
Home Financials for this Owner
Home Financials are based on the most recent Mortgage that was taken out on this home.
Original Mortgage
$59,850
Interest Rate
7.44%
Mortgage Type
New Conventional
Create a Home Valuation Report for This Property
The Home Valuation Report is an in-depth analysis detailing your home's value as well as a comparison with similar homes in the area
Home Values in the Area
Average Home Value in this Area
Purchase History
| Date | Buyer | Sale Price | Title Company |
|---|---|---|---|
| Ridgway Alan L | -- | None Available | |
| Koivula Dennis | $90,000 | Capital Title Agency Inc | |
| Rauch James E | $63,000 | Ati Title Agency |
Source: Public Records
Mortgage History
| Date | Status | Borrower | Loan Amount |
|---|---|---|---|
| Open | Koivula Dennis | $72,000 | |
| Previous Owner | Rauch James E | $59,850 | |
| Closed | Koivula Dennis | $13,500 |
Source: Public Records
Tax History Compared to Growth
Tax History
| Year | Tax Paid | Tax Assessment Tax Assessment Total Assessment is a certain percentage of the fair market value that is determined by local assessors to be the total taxable value of land and additions on the property. | Land | Improvement |
|---|---|---|---|---|
| 2025 | $951 | $8,842 | -- | -- |
| 2024 | $912 | $8,421 | -- | -- |
| 2023 | $912 | $19,130 | $3,820 | $15,310 |
| 2022 | $869 | $14,650 | $2,930 | $11,720 |
| 2021 | $889 | $14,030 | $2,800 | $11,230 |
| 2020 | $869 | $11,860 | $2,370 | $9,490 |
| 2019 | $843 | $10,260 | $2,050 | $8,210 |
| 2018 | $818 | $9,170 | $1,830 | $7,340 |
| 2017 | $786 | $8,410 | $1,680 | $6,730 |
| 2016 | $793 | $7,400 | $1,480 | $5,920 |
| 2015 | $630 | $6,860 | $1,370 | $5,490 |
Source: Public Records
Map
Nearby Homes
- 1046 E Carmen St
- 6736 S Stanley Place
- 6736 S Rita Ln
- 6406 S Lakeshore Dr Unit D
- 1032 E Redfield Rd
- 6818 S Terrace Rd
- 1310 E Redmon Dr
- 6810 S Snyder Ln
- 1402 E Guadalupe Rd Unit 153
- 1402 E Guadalupe Rd Unit 149
- 1402 E Guadalupe Rd Unit 248
- 6801 S Palm Dr
- 1112 E Westchester Dr
- 6556 S La Rosa Dr
- 1508 E Carmen St Unit 2
- 5935 S Lakeshore Dr
- 6512 S Mcallister Ave
- 1019 E Watson Dr
- 1527 E Bell de Mar Dr
- 5924 S Jentilly Ln
- 6505 S Newberry Rd Unit C
- 6505 S Newberry Rd Unit A
- 6506 S Newberry Rd Unit A
- 6506 S Newberry Rd Unit D
- 6512 S Newberry Rd Unit C
- 6512 S Newberry Rd Unit A
- 6512 S Newberry Rd Unit B
- 6512 S Newberry Rd Unit D
- 1111 E Redondo Cir
- 1133 E Redmon Dr Unit C
- 1133 E Redmon Dr Unit A
- 1133 E Redmon Dr Unit D
- 1133 E Redmon Dr Unit B
- 1133 E Redmon Dr
- 6518 S Newberry Rd Unit C
- 6518 S Newberry Rd Unit B
- 6518 S Newberry Rd Unit A
- 6518 S Newberry Rd Unit D
- 1134 E Vaughn St Unit A
- 1134 E Vaughn St Unit C