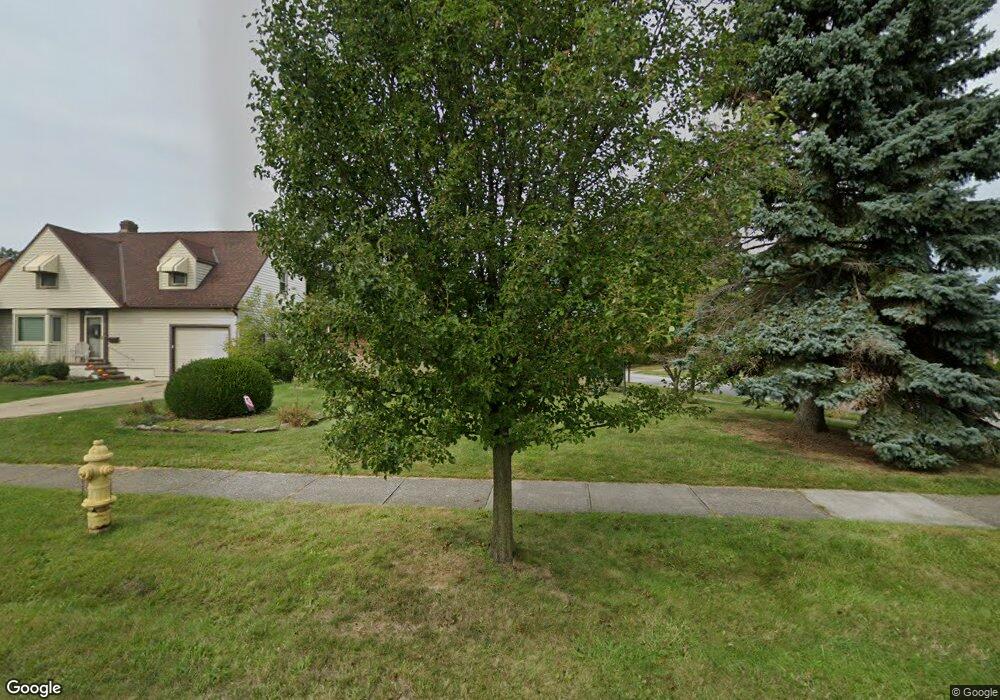
6506 S Canterbury Rd Cleveland, OH 44129
Estimated Value: $200,000 - $216,000
3
Beds
1
Bath
1,136
Sq Ft
$183/Sq Ft
Est. Value
About This Home
This home is located at 6506 S Canterbury Rd, Cleveland, OH 44129 and is currently estimated at $207,624, approximately $182 per square foot. 6506 S Canterbury Rd is a home located in Cuyahoga County with nearby schools including Greenbriar Middle School, Pleasant Valley Elementary School, and Valley Forge High School.
Ownership History
Date
Name
Owned For
Owner Type
Purchase Details
Closed on
Nov 8, 2022
Sold by
Paszter Eric E
Bought by
Paszter Eric E and Paszter Eva
Current Estimated Value
Purchase Details
Closed on
Oct 16, 2002
Sold by
Aleandri Mark
Bought by
Paszter Eric E
Home Financials for this Owner
Home Financials are based on the most recent Mortgage that was taken out on this home.
Original Mortgage
$40,000
Interest Rate
6.24%
Purchase Details
Closed on
Jun 4, 1996
Sold by
Malaga Robert S
Bought by
Aleandri Mark J and Aleandri Jacqueline K
Home Financials for this Owner
Home Financials are based on the most recent Mortgage that was taken out on this home.
Original Mortgage
$85,000
Interest Rate
7.99%
Mortgage Type
New Conventional
Purchase Details
Closed on
May 21, 1986
Sold by
Steinhoff Richard H
Bought by
Malaga Robert S
Purchase Details
Closed on
Oct 13, 1982
Bought by
Steinhoff Richard H
Purchase Details
Closed on
Jan 1, 1975
Bought by
Union Commerce Bank Tr
Create a Home Valuation Report for This Property
The Home Valuation Report is an in-depth analysis detailing your home's value as well as a comparison with similar homes in the area
Home Values in the Area
Average Home Value in this Area
Purchase History
| Date | Buyer | Sale Price | Title Company |
|---|---|---|---|
| Paszter Eric E | -- | None Listed On Document | |
| Paszter Eric E | $110,000 | Affiliated Title | |
| Aleandri Mark J | $100,000 | -- | |
| Malaga Robert S | $61,500 | -- | |
| Steinhoff Richard H | -- | -- | |
| Union Commerce Bank Tr | -- | -- |
Source: Public Records
Mortgage History
| Date | Status | Borrower | Loan Amount |
|---|---|---|---|
| Previous Owner | Paszter Eric E | $40,000 | |
| Previous Owner | Aleandri Mark J | $85,000 |
Source: Public Records
Tax History Compared to Growth
Tax History
| Year | Tax Paid | Tax Assessment Tax Assessment Total Assessment is a certain percentage of the fair market value that is determined by local assessors to be the total taxable value of land and additions on the property. | Land | Improvement |
|---|---|---|---|---|
| 2024 | $3,888 | $63,035 | $13,405 | $49,630 |
| 2023 | $3,388 | $47,220 | $11,870 | $35,350 |
| 2022 | $3,357 | $47,220 | $11,870 | $35,350 |
| 2021 | $3,452 | $47,220 | $11,870 | $35,350 |
| 2020 | $3,029 | $36,330 | $9,140 | $27,200 |
| 2019 | $2,905 | $103,800 | $26,100 | $77,700 |
| 2018 | $2,922 | $36,330 | $9,140 | $27,200 |
| 2017 | $2,711 | $31,290 | $7,770 | $23,520 |
| 2016 | $2,695 | $31,290 | $7,770 | $23,520 |
| 2015 | $2,587 | $31,290 | $7,770 | $23,520 |
| 2014 | $2,587 | $31,930 | $7,950 | $23,980 |
Source: Public Records
Map
Nearby Homes
- 8218 Covington Ave
- 8314 Oxford Dr
- 6439 Keltonshire Rd
- 6430 Monmouth Dr
- 6413 Alderwood Rd
- 6485 Buckingham Dr
- 6474 Ridge Rd
- 8963 Lynnhaven Rd
- 8017 Ackley Rd
- 8017 Wainstead Dr
- 6921 Hollywood Dr
- 6298 Chestnut Hills Dr
- 6418 Newland Rd
- 6234 N Canterbury Rd
- 6227 Ridge Rd
- 9474 Stoney Creek Ln
- 6431 W Ridgewood Dr
- 6525 Aylesworth Dr
- 6510 Belmere Dr
- 6168 Manchester Rd
- 6512 S Canterbury Rd
- 6516 S Canterbury Rd
- 8105 Manorford Dr
- 6494 S Canterbury Rd
- 8111 Manorford Dr
- 8102 Manorford Dr
- 6522 S Canterbury Rd
- 6488 S Canterbury Rd
- 8106 Manorford Dr
- 8117 Manorford Dr
- 6515 S Canterbury Rd
- 6511 S Canterbury Rd
- 8112 Manorford Dr
- 6484 S Canterbury Rd
- 6507 S Canterbury Rd
- 6528 S Canterbury Rd
- 8112 Salisbury Dr
- 6521 S Canterbury Rd
- 8121 Manorford Dr
- 8116 Manorford Dr