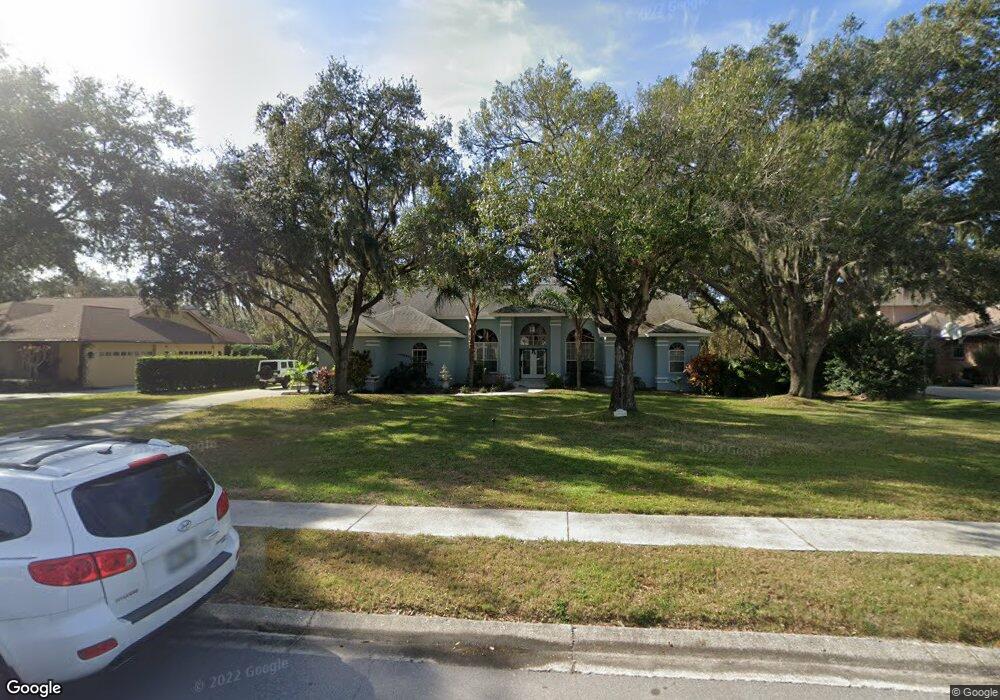
6506 Spyglass Ln Bradenton, FL 34202
Estimated Value: $924,686 - $1,021,000
5
Beds
4
Baths
3,531
Sq Ft
$277/Sq Ft
Est. Value
About This Home
This home is located at 6506 Spyglass Ln, Bradenton, FL 34202 and is currently estimated at $976,422, approximately $276 per square foot. 6506 Spyglass Ln is a home located in Manatee County with nearby schools including Braden River Elementary School, Lakewood Ranch High School, and Braden River Middle School.
Ownership History
Date
Name
Owned For
Owner Type
Purchase Details
Closed on
Jul 28, 2011
Sold by
Wells Fargo Bank Na
Bought by
Renfrow Ballard John Olen and Renfrow Ballard Cheryl
Current Estimated Value
Home Financials for this Owner
Home Financials are based on the most recent Mortgage that was taken out on this home.
Original Mortgage
$331,381
Outstanding Balance
$228,694
Interest Rate
4.5%
Mortgage Type
FHA
Estimated Equity
$747,728
Purchase Details
Closed on
Apr 6, 2011
Sold by
Gereg Robert J and Gereg Kathleen A
Bought by
Wells Fargo Bank N A
Purchase Details
Closed on
Jun 25, 2006
Sold by
Sivik Jeanette
Bought by
Gereg Robert J and Gereg Kathleen A
Purchase Details
Closed on
Aug 29, 2003
Sold by
Davis Daniel Ray and Davis Cheryl Lynn
Bought by
Sivik Jeanette
Home Financials for this Owner
Home Financials are based on the most recent Mortgage that was taken out on this home.
Original Mortgage
$364,800
Interest Rate
5.94%
Create a Home Valuation Report for This Property
The Home Valuation Report is an in-depth analysis detailing your home's value as well as a comparison with similar homes in the area
Home Values in the Area
Average Home Value in this Area
Purchase History
| Date | Buyer | Sale Price | Title Company |
|---|---|---|---|
| Renfrow Ballard John Olen | $340,000 | Century Title Closing & Escr | |
| Wells Fargo Bank N A | $100,100 | Attorney | |
| Gereg Robert J | $353,200 | Attorney | |
| Sivik Jeanette | $456,000 | -- |
Source: Public Records
Mortgage History
| Date | Status | Borrower | Loan Amount |
|---|---|---|---|
| Open | Renfrow Ballard John Olen | $331,381 | |
| Previous Owner | Sivik Jeanette | $364,800 |
Source: Public Records
Tax History Compared to Growth
Tax History
| Year | Tax Paid | Tax Assessment Tax Assessment Total Assessment is a certain percentage of the fair market value that is determined by local assessors to be the total taxable value of land and additions on the property. | Land | Improvement |
|---|---|---|---|---|
| 2025 | $5,049 | $384,650 | -- | -- |
| 2024 | $5,049 | $373,810 | -- | -- |
| 2023 | $5,049 | $362,922 | $0 | $0 |
| 2022 | $4,934 | $352,351 | $0 | $0 |
| 2021 | $4,736 | $342,088 | $0 | $0 |
| 2020 | $4,899 | $337,365 | $0 | $0 |
| 2019 | $4,836 | $329,780 | $0 | $0 |
| 2018 | $4,804 | $323,631 | $0 | $0 |
| 2017 | $4,485 | $316,975 | $0 | $0 |
| 2016 | $4,483 | $310,455 | $0 | $0 |
| 2015 | $4,546 | $308,297 | $0 | $0 |
| 2014 | $4,546 | $305,850 | $0 | $0 |
| 2013 | $4,535 | $301,330 | $0 | $0 |
Source: Public Records
Map
Nearby Homes
- 6647 Oakbrooke Cir
- 6622 Oakbrooke Cir
- 10216 Woodborne Place
- 6337 99th St E
- 10009 Clubhouse Dr
- 6764 Hickory Hammock Cir
- 10404 Palmbrooke Terrace
- 6418 Rosefinch Ct Unit 103
- 6412 Rosefinch Ct Unit 204
- 6407 Rosefinch Ct Unit 201
- 6102 Sonesta Ct
- 6309 Rosefinch Ct Unit 201
- 6107 Glen Abbey Ln
- 11019 Pine Lilly Place
- 11206 Pine Lilly Place
- 6911 Riversedge Street Cir
- 11209 Pine Lilly Place
- 6907 River Birch Ct
- 11022 Pine Lilly Place
- 6905 Pine Valley St
- 6510 Spyglass Ln
- 6502 Spyglass Ln
- 6514 Spyglass Ln
- 6422 Spyglass Ln
- 6505 Spyglass Ln
- 6509 Spyglass Ln
- 6501 Spyglass Ln
- 6511 Spyglass Ln
- 6417 Spyglass Ln
- 6418 Spyglass Ln
- 6518 Spyglass Ln
- 6517 Spyglass Ln
- 6517 Lane
- 6413 Spyglass Ln
- 6414 Spyglass Ln
- 6521 Spyglass Ln
- 6666 Oakbrooke Cir
- 6662 Circle
- 6409 Spyglass Ln