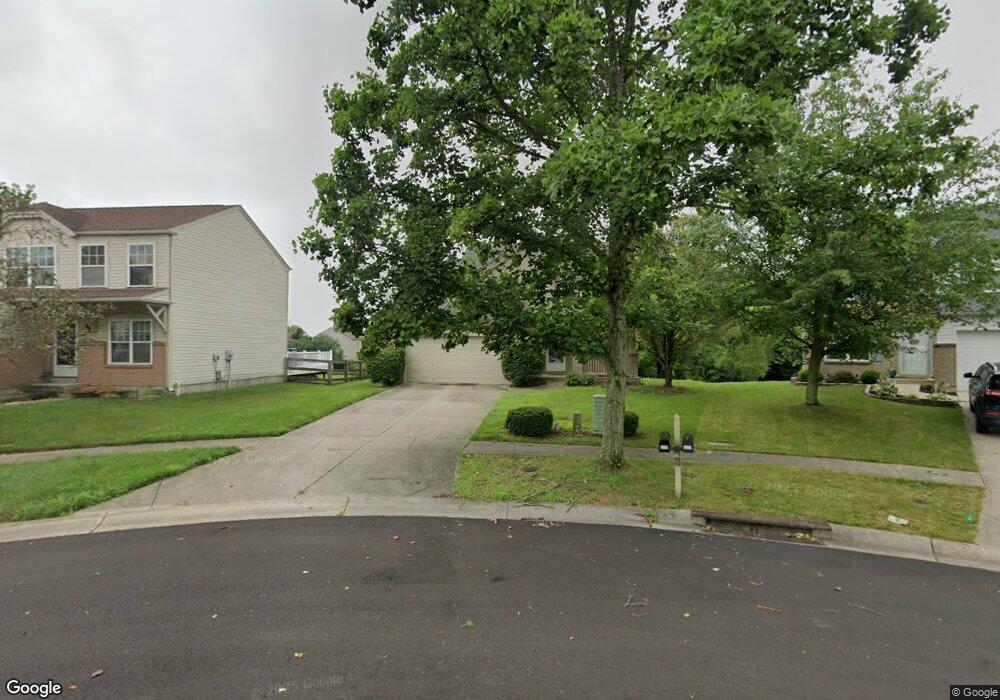
6509 Black Forest Ct Morrow, OH 45152
Estimated Value: $305,382 - $327,000
3
Beds
3
Baths
1,436
Sq Ft
$222/Sq Ft
Est. Value
About This Home
This home is located at 6509 Black Forest Ct, Morrow, OH 45152 and is currently estimated at $318,346, approximately $221 per square foot. 6509 Black Forest Ct is a home located in Warren County with nearby schools including Little Miami Early Childhood Center, Little Miami Intermediate Middle School, and Little Miami Middle School.
Ownership History
Date
Name
Owned For
Owner Type
Purchase Details
Closed on
Feb 1, 2006
Sold by
Jones Betty Anne and Jones Wendell D
Bought by
Paugh K J
Current Estimated Value
Home Financials for this Owner
Home Financials are based on the most recent Mortgage that was taken out on this home.
Original Mortgage
$129,920
Outstanding Balance
$71,762
Interest Rate
6.37%
Mortgage Type
Fannie Mae Freddie Mac
Estimated Equity
$246,584
Purchase Details
Closed on
Feb 21, 2002
Sold by
Maple Street Homes Llc
Bought by
Jones Betty A and Jones Wendell D
Purchase Details
Closed on
Nov 16, 2001
Sold by
Grand Comm Ltd
Bought by
Maple Street Homes Llc
Create a Home Valuation Report for This Property
The Home Valuation Report is an in-depth analysis detailing your home's value as well as a comparison with similar homes in the area
Home Values in the Area
Average Home Value in this Area
Purchase History
| Date | Buyer | Sale Price | Title Company |
|---|---|---|---|
| Paugh K J | $162,400 | Lawyers Title | |
| Jones Betty A | $137,500 | -- | |
| Maple Street Homes Llc | $76,506 | -- |
Source: Public Records
Mortgage History
| Date | Status | Borrower | Loan Amount |
|---|---|---|---|
| Open | Paugh K J | $129,920 |
Source: Public Records
Tax History
| Year | Tax Paid | Tax Assessment Tax Assessment Total Assessment is a certain percentage of the fair market value that is determined by local assessors to be the total taxable value of land and additions on the property. | Land | Improvement |
|---|---|---|---|---|
| 2025 | $3,549 | $78,840 | $21,000 | $57,840 |
| 2024 | $3,549 | $78,840 | $21,000 | $57,840 |
| 2023 | $3,132 | $62,006 | $10,762 | $51,243 |
| 2022 | $3,100 | $62,006 | $10,763 | $51,244 |
| 2021 | $2,957 | $62,006 | $10,763 | $51,244 |
| 2020 | $2,816 | $50,411 | $8,750 | $41,661 |
| 2019 | $2,862 | $50,411 | $8,750 | $41,661 |
| 2018 | $2,746 | $50,411 | $8,750 | $41,661 |
| 2017 | $2,397 | $43,190 | $7,623 | $35,567 |
| 2016 | $2,453 | $43,190 | $7,623 | $35,567 |
| 2015 | $2,449 | $43,190 | $7,623 | $35,567 |
| 2014 | $2,496 | $39,260 | $6,930 | $32,330 |
| 2013 | $2,424 | $49,570 | $8,750 | $40,820 |
Source: Public Records
Map
Nearby Homes
- 6535 Abingdon Hall
- 6714 Bedington Ln
- 7000 Quellin Blvd
- 1497 Wexler Ct
- 1065 Dunstan Ct
- 7078 Quellin Blvd
- 1123 Carrington Place
- 767 Elm Tree Dr
- 723 Grande Oaks Dr
- 792 Oak Forest Dr
- 668 Thornton Dr
- 2311 Sir Barton Dr
- 5976 Outlook Ct
- 1491 Wexler Ct
- 1358 Brookchase Cir
- 480 Charismatic Ct
- 5817 Montrose Ct
- 7409 Wildberry Ct
- 437 Crossbow Dr
- 5234 Highmeadow Place
- 6519 Black Forest Ct
- 6503 Black Forest Ct
- 6529 Black Forest Ct
- 6501 Black Forest Ct
- 6528 Brampton Abbey
- 6532 Brampton Abbey
- 6500 Black Forest Ct
- 6527 Brampton Abbey
- 6510 Black Forest Ct
- 6520 Black Forest Ct
- 6549 Black Forest Ct
- 6504 Black Forest Ct
- 6530 Black Forest Ct
- 6540 Brampton Abbey
- 6540 Black Forest Ct
- 6559 Black Forest Ct
- 6529 Brampton Abbey
- 6550 Brampton Abbey
- 6550 Black Forest Ct
- 6569 Black Forest Ct
Your Personal Tour Guide
Ask me questions while you tour the home.