6509 Ocean Front Walk Playa Del Rey, CA 90293
Estimated Value: $2,356,498 - $4,416,000
5
Beds
4
Baths
2,411
Sq Ft
$1,381/Sq Ft
Est. Value
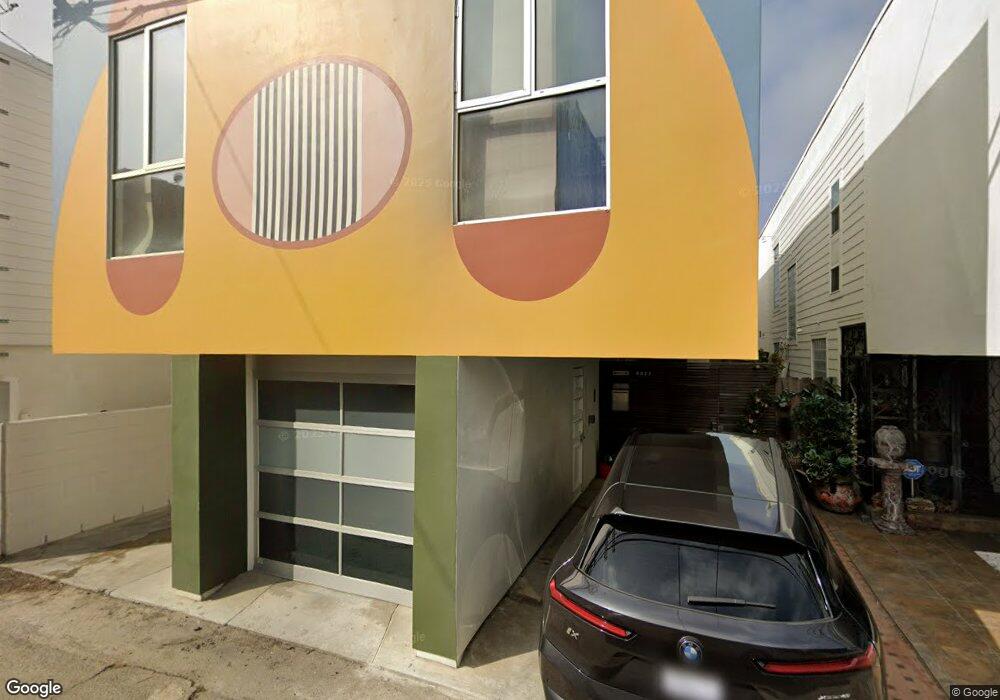
About This Home
This home is located at 6509 Ocean Front Walk, Playa Del Rey, CA 90293 and is currently estimated at $3,329,375, approximately $1,380 per square foot. 6509 Ocean Front Walk is a home located in Los Angeles County with nearby schools including Paseo Del Rey Natural Science Magnet, Loyola Village Elementary School, and Kentwood Elementary.
Ownership History
Date
Name
Owned For
Owner Type
Purchase Details
Closed on
Dec 22, 2010
Sold by
Karpman Laura
Bought by
Karpman Laura Anne and Laura Anne Karpman Living Trust
Current Estimated Value
Purchase Details
Closed on
Jun 29, 2009
Sold by
Karpman Laura
Bought by
Karpman Laura and The Rodelle Karpman Living Trust
Purchase Details
Closed on
Jun 15, 2009
Sold by
Karpman Md Harold L and The Harold L Karpman Md Living
Bought by
Karpman Laura and The Laura Karpman Exempt Gst Trust
Purchase Details
Closed on
Nov 6, 2008
Sold by
Karpman David Stephen and Karpman Laura Anne
Bought by
Karpman Laura and Rodelle Karpman Living Trust
Purchase Details
Closed on
Apr 2, 1998
Sold by
Trust Karpman Harold L Tr Harold L Karpm
Bought by
Karpman Laura A
Purchase Details
Closed on
Dec 31, 1996
Sold by
Trust Karpman Harold L Tr Harold L Karpm
Bought by
Karpman Laura A
Purchase Details
Closed on
Apr 26, 1995
Sold by
Karpman Rodelle
Bought by
Rodelle Karpman Living Trust
Create a Home Valuation Report for This Property
The Home Valuation Report is an in-depth analysis detailing your home's value as well as a comparison with similar homes in the area
Home Values in the Area
Average Home Value in this Area
Purchase History
| Date | Buyer | Sale Price | Title Company |
|---|---|---|---|
| Karpman Laura Anne | -- | None Available | |
| Karpman Laura | -- | Accommodation | |
| Karpman Laura | -- | Lawyers Title | |
| Karpman Laura | -- | Lawyers Title | |
| Karpman Laura | -- | Lawyers Title | |
| Karpman Laura | -- | None Available | |
| Karpman Laura A | -- | -- | |
| Karpman Laura A | -- | -- | |
| Rodelle Karpman Living Trust | -- | -- |
Source: Public Records
Tax History Compared to Growth
Tax History
| Year | Tax Paid | Tax Assessment Tax Assessment Total Assessment is a certain percentage of the fair market value that is determined by local assessors to be the total taxable value of land and additions on the property. | Land | Improvement |
|---|---|---|---|---|
| 2025 | $3,454 | $271,594 | $167,675 | $103,919 |
| 2024 | $3,454 | $266,270 | $164,388 | $101,882 |
| 2023 | $3,394 | $261,050 | $161,165 | $99,885 |
| 2022 | $3,244 | $255,932 | $158,005 | $97,927 |
| 2021 | $3,189 | $250,914 | $154,907 | $96,007 |
| 2019 | $3,096 | $243,473 | $150,313 | $93,160 |
| 2018 | $3,054 | $238,700 | $147,366 | $91,334 |
| 2016 | $2,898 | $229,434 | $141,645 | $87,789 |
| 2015 | $2,857 | $225,989 | $139,518 | $86,471 |
| 2014 | $2,880 | $221,564 | $136,786 | $84,778 |
Source: Public Records
Map
Nearby Homes
- 6521 Pacific Ave
- 6400 Pacific Ave Unit 306
- 6400 Pacific Ave Unit 309
- 6400 Pacific Ave Unit 308
- 6220 Pacific Ave Unit 303
- 6209 Pacific Ave Unit 201
- 6202 Pacific Ave
- 6515 Vista Del Mar
- 6635 Vista Del Mar
- 6690 Vista Del Mar Unit H
- 6935 Trolleyway
- 323 Culver Blvd
- 210 Montreal St
- 6929 Vista Del Mar Ln
- 372 Pershing Dr
- 116 Rees St
- 7045 Trolleyway
- 6916 Vista Del Mar Ln
- 115 Via Marina
- 7300 Vista Del Mar Ln
- 6505 Ocean Front Walk
- 6507 Ocean Front Walk
- 6517 Ocean Front Walk Unit A
- 6517 Ocean Front Walk Unit 1/2
- 6517 Ocean Front Walk Unit B
- 6517 Ocean Front Walk
- 6501 Ocean Front Walk
- 3 66th Ave
- 6505 Pacific Ave
- 6517 Pacific Ave
- 6419 Ocean Front Walk
- 16 65th Ave
- 19 66th Ave
- 6601 Ocean Front Walk Unit upper
- 6601 Ocean Front Walk Unit 2
- 6601 Ocean Front Walk
- 6417 Ocean Front Walk
- 6603 Ocean Front Walk
- 6413 Ocean Front Walk
- 6605 Ocean Front Walk