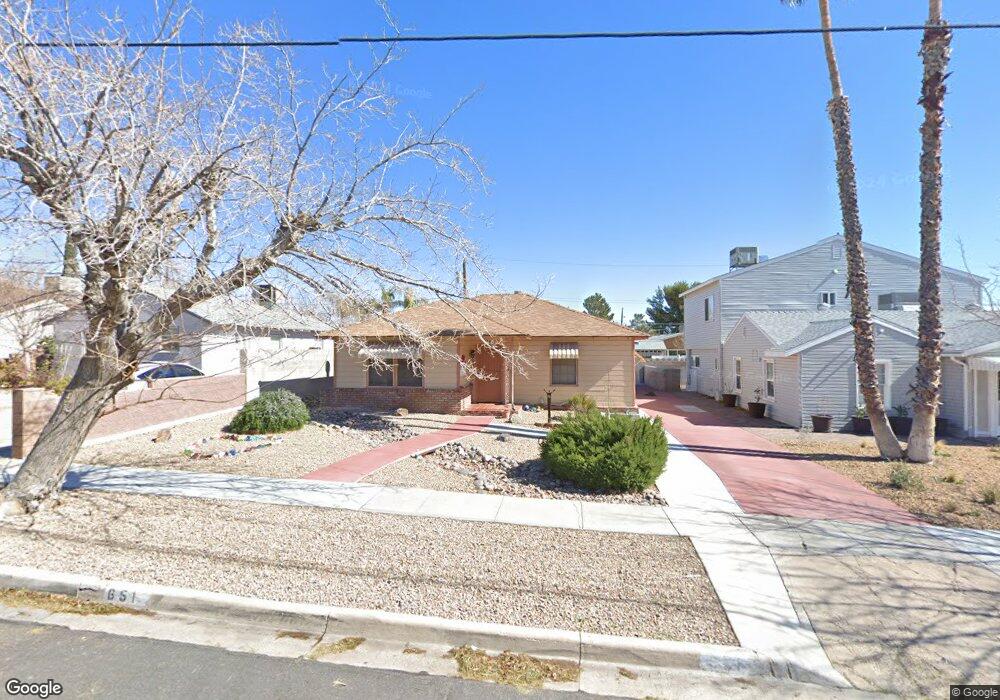
651 Avenue I Boulder City, NV 89005
Estimated Value: $429,739 - $489,000
3
Beds
1
Bath
1,318
Sq Ft
$344/Sq Ft
Est. Value
About This Home
This home is located at 651 Avenue I, Boulder City, NV 89005 and is currently estimated at $452,935, approximately $343 per square foot. 651 Avenue I is a home located in Clark County with nearby schools including Andrew Mitchell Elementary School, Martha P. King Elementary School, and Elton M. & Madelaine E. Garrett Junior High School.
Ownership History
Date
Name
Owned For
Owner Type
Purchase Details
Closed on
Mar 15, 2021
Sold by
Ronald E Cornell Trust and Ronald E Cornell Trust
Bought by
Mark Cornell Revocable Trust and Cornell
Current Estimated Value
Purchase Details
Closed on
Dec 17, 2014
Sold by
Cornell Ronald E
Bought by
Cornell Ronald E and Ronald E Cornell Trust
Purchase Details
Closed on
Aug 20, 2009
Sold by
Ballard Lynda Joan and Ballard Norman
Bought by
Cornell Ronald E
Create a Home Valuation Report for This Property
The Home Valuation Report is an in-depth analysis detailing your home's value as well as a comparison with similar homes in the area
Home Values in the Area
Average Home Value in this Area
Purchase History
| Date | Buyer | Sale Price | Title Company |
|---|---|---|---|
| Mark Cornell Revocable Trust | -- | None Listed On Document | |
| Cornell Ronald E | -- | None Available | |
| Cornell Ronald E | $35,000 | Nevada Title Las Vegas |
Source: Public Records
Tax History Compared to Growth
Tax History
| Year | Tax Paid | Tax Assessment Tax Assessment Total Assessment is a certain percentage of the fair market value that is determined by local assessors to be the total taxable value of land and additions on the property. | Land | Improvement |
|---|---|---|---|---|
| 2025 | $1,055 | $68,362 | $49,000 | $19,362 |
| 2024 | $1,055 | $68,362 | $49,000 | $19,362 |
| 2023 | $1,055 | $54,192 | $36,750 | $17,442 |
| 2022 | $977 | $48,844 | $33,250 | $15,594 |
| 2021 | $905 | $44,976 | $30,450 | $14,526 |
| 2020 | $840 | $42,832 | $28,700 | $14,132 |
| 2019 | $816 | $39,885 | $26,250 | $13,635 |
| 2018 | $778 | $35,532 | $22,750 | $12,782 |
| 2017 | $879 | $33,667 | $21,000 | $12,667 |
| 2016 | $728 | $28,034 | $15,750 | $12,284 |
| 2015 | $726 | $27,647 | $15,750 | $11,897 |
| 2014 | $712 | $27,306 | $15,750 | $11,556 |
Source: Public Records
Map
Nearby Homes