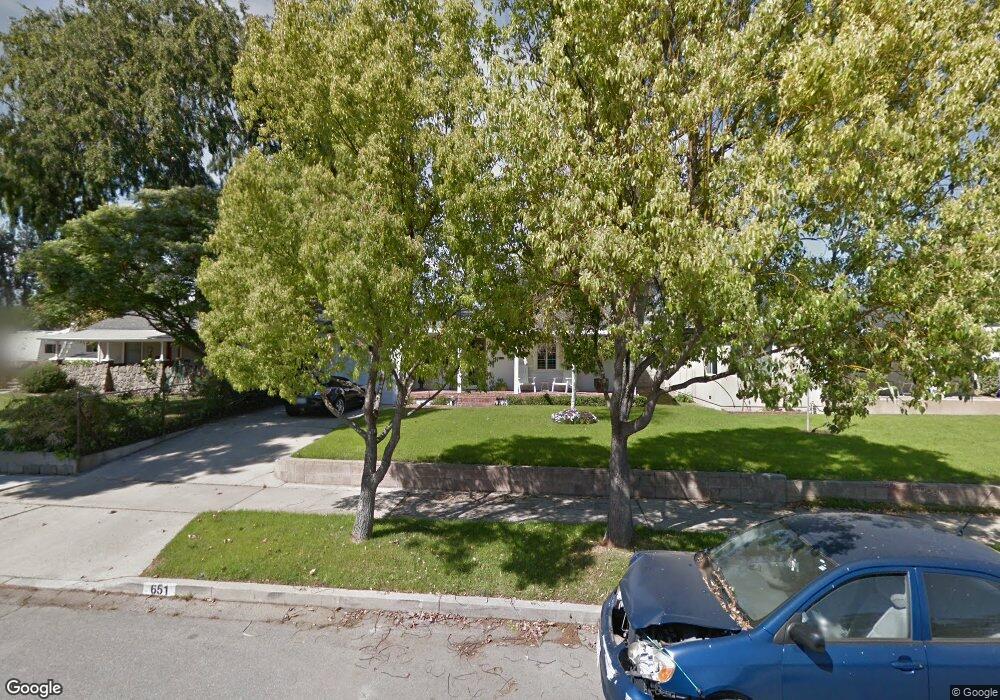
651 E Harvard Place Ontario, CA 91764
Downtown Ontario NeighborhoodEstimated Value: $588,000 - $689,000
2
Beds
1
Bath
934
Sq Ft
$676/Sq Ft
Est. Value
About This Home
This home is located at 651 E Harvard Place, Ontario, CA 91764 and is currently estimated at $631,390, approximately $676 per square foot. 651 E Harvard Place is a home located in San Bernardino County with nearby schools including Edison Elementary School, Vina Danks Middle, and Chaffey High School.
Ownership History
Date
Name
Owned For
Owner Type
Purchase Details
Closed on
Jul 27, 2001
Sold by
Finkelstein Pauline
Bought by
Martelli Juliet V
Current Estimated Value
Home Financials for this Owner
Home Financials are based on the most recent Mortgage that was taken out on this home.
Original Mortgage
$135,584
Outstanding Balance
$53,118
Interest Rate
7.21%
Mortgage Type
FHA
Estimated Equity
$578,272
Purchase Details
Closed on
Sep 24, 1996
Sold by
Silva Lynda
Bought by
Finkelstein Pauline
Home Financials for this Owner
Home Financials are based on the most recent Mortgage that was taken out on this home.
Original Mortgage
$69,600
Interest Rate
7.37%
Purchase Details
Closed on
Aug 23, 1996
Sold by
Hayes Eva H
Bought by
Silva Lynda S
Home Financials for this Owner
Home Financials are based on the most recent Mortgage that was taken out on this home.
Original Mortgage
$69,600
Interest Rate
7.37%
Create a Home Valuation Report for This Property
The Home Valuation Report is an in-depth analysis detailing your home's value as well as a comparison with similar homes in the area
Home Values in the Area
Average Home Value in this Area
Purchase History
| Date | Buyer | Sale Price | Title Company |
|---|---|---|---|
| Martelli Juliet V | $137,500 | Northern Counties Title | |
| Finkelstein Pauline | -- | -- | |
| Silva Lynda | -- | -- | |
| Silva Lynda S | $87,000 | North American Title Co |
Source: Public Records
Mortgage History
| Date | Status | Borrower | Loan Amount |
|---|---|---|---|
| Open | Martelli Juliet V | $135,584 | |
| Previous Owner | Silva Lynda S | $69,600 |
Source: Public Records
Tax History
| Year | Tax Paid | Tax Assessment Tax Assessment Total Assessment is a certain percentage of the fair market value that is determined by local assessors to be the total taxable value of land and additions on the property. | Land | Improvement |
|---|---|---|---|---|
| 2025 | $2,997 | $278,610 | $81,252 | $197,358 |
| 2024 | $2,927 | $273,147 | $79,659 | $193,488 |
| 2023 | $2,059 | $195,241 | $78,096 | $117,145 |
| 2022 | $2,030 | $191,413 | $76,565 | $114,848 |
| 2021 | $2,016 | $187,660 | $75,064 | $112,596 |
| 2020 | $1,980 | $185,735 | $74,294 | $111,441 |
| 2019 | $1,962 | $182,093 | $72,837 | $109,256 |
| 2018 | $1,933 | $178,523 | $71,409 | $107,114 |
| 2017 | $1,862 | $175,023 | $70,009 | $105,014 |
| 2016 | $1,788 | $171,591 | $68,636 | $102,955 |
| 2015 | $1,775 | $169,014 | $67,605 | $101,409 |
| 2014 | $1,718 | $165,704 | $66,281 | $99,423 |
Source: Public Records
Map
Nearby Homes
- 405 E Harvard Place
- 1420 N Marcella
- 931 E Princeton St
- 806 E I St
- 943 E Yale St
- 945 E 5th St
- 326 E I St
- 712 E H St
- 802 E Granada Ct
- 945 E I St
- 1038 E J St
- 839 Richland St
- 1097 Richland St
- 1354 Virginia Ave
- 535 N Allyn Ave
- 308 S Campus Ave
- 821 N Alameda Ave
- 340 W Caroline Ct
- 341 Muscatel Ave
- 517 W I St
- 651 E Harvard Place Unit B
- 655 E Harvard Place
- 645 E Harvard Place
- 661 E Harvard Place
- 637 E Harvard Place
- 644 E Princeton St
- 665 E Harvard Place
- 1155 N Campus Ave
- 642 E Princeton St
- 652 E Harvard Place
- 1125 N Campus Ave
- 631 E Harvard Place
- 648 E Harvard Place
- 640 E Princeton St
- 664 E Princeton St
- 640 E Harvard Place
- 636 E Princeton St
- 636 E Harvard Place
- 627 E Harvard Place
- 1119 N Campus Ave
Your Personal Tour Guide
Ask me questions while you tour the home.