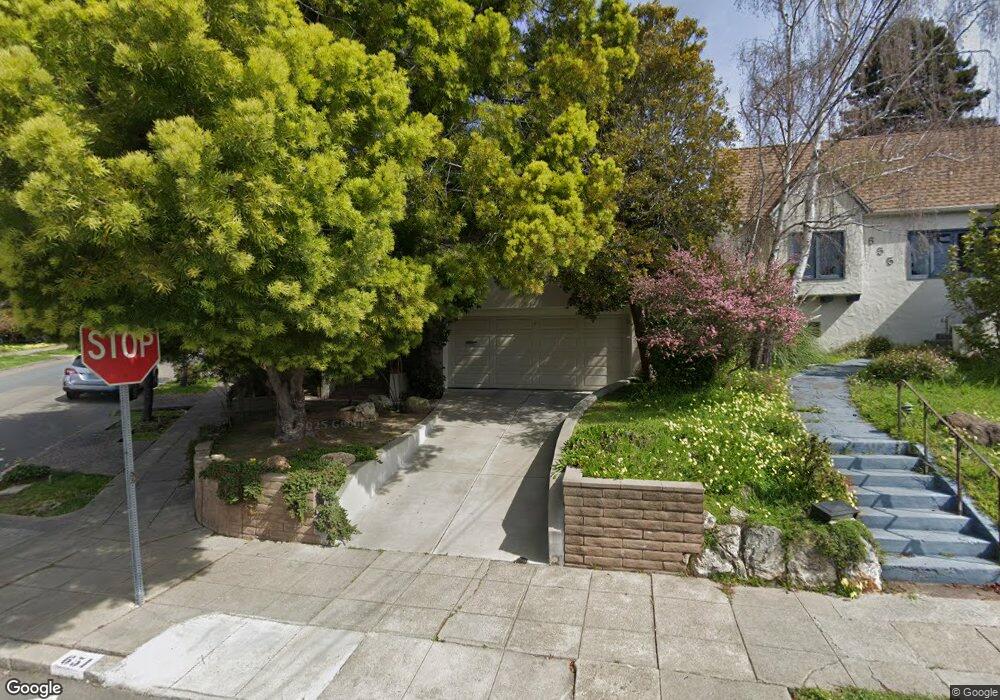
651 Ensenada Ave Berkeley, CA 94707
Thousand Oaks NeighborhoodEstimated Value: $1,678,000 - $1,923,000
3
Beds
2
Baths
1,798
Sq Ft
$992/Sq Ft
Est. Value
About This Home
This home is located at 651 Ensenada Ave, Berkeley, CA 94707 and is currently estimated at $1,782,827, approximately $991 per square foot. 651 Ensenada Ave is a home located in Alameda County with nearby schools including Thousand Oaks Elementary School, Ruth Acty Elementary, and Berkeley Arts Magnet at Whittier School.
Ownership History
Date
Name
Owned For
Owner Type
Purchase Details
Closed on
Jul 12, 2013
Sold by
Cirksena Elizabeth Ann and Gassler Pauline A
Bought by
Cirksena Elizabeth Ann and Gassler Pauline A
Current Estimated Value
Purchase Details
Closed on
Apr 24, 2009
Sold by
Cirksena Elizabeth Ann and Gassler Pauline A
Bought by
Cirksena Elizabeth Ann and Gassler Pauline A
Home Financials for this Owner
Home Financials are based on the most recent Mortgage that was taken out on this home.
Original Mortgage
$239,500
Interest Rate
4.99%
Mortgage Type
New Conventional
Purchase Details
Closed on
May 11, 2007
Sold by
Cirksena Ann and Gassler Pauline A
Bought by
Cirksena Elizabeth Ann and Gassler Pauline A
Create a Home Valuation Report for This Property
The Home Valuation Report is an in-depth analysis detailing your home's value as well as a comparison with similar homes in the area
Home Values in the Area
Average Home Value in this Area
Purchase History
| Date | Buyer | Sale Price | Title Company |
|---|---|---|---|
| Cirksena Elizabeth Ann | -- | None Available | |
| Cirksena Elizabeth Ann | -- | Integrated Title Inc | |
| Cirksena Elizabeth Ann | -- | None Available |
Source: Public Records
Mortgage History
| Date | Status | Borrower | Loan Amount |
|---|---|---|---|
| Closed | Cirksena Elizabeth Ann | $239,500 |
Source: Public Records
Tax History
| Year | Tax Paid | Tax Assessment Tax Assessment Total Assessment is a certain percentage of the fair market value that is determined by local assessors to be the total taxable value of land and additions on the property. | Land | Improvement |
|---|---|---|---|---|
| 2025 | $11,505 | $615,255 | $186,676 | $435,579 |
| 2024 | $11,505 | $603,055 | $183,016 | $427,039 |
| 2023 | $11,189 | $598,094 | $179,428 | $418,666 |
| 2022 | $10,891 | $579,368 | $175,910 | $410,458 |
| 2021 | $10,892 | $567,873 | $172,462 | $402,411 |
| 2020 | $10,255 | $568,980 | $170,694 | $398,286 |
| 2019 | $9,784 | $557,826 | $167,348 | $390,478 |
| 2018 | $9,586 | $546,890 | $164,067 | $382,823 |
| 2017 | $9,241 | $536,167 | $160,850 | $375,317 |
| 2016 | $8,883 | $525,655 | $157,696 | $367,959 |
| 2015 | $8,747 | $517,761 | $155,328 | $362,433 |
| 2014 | $8,602 | $507,621 | $152,286 | $355,335 |
Source: Public Records
Map
Nearby Homes
- 753 Peralta Ave
- 415 Berkeley Park Blvd
- 491 Vincente Ave
- 1858 San Lorenzo Ave
- 118 Ramona Ave
- 145 Ramona Ave
- 1266 Washington Ave
- 1983 Yosemite Rd
- 712 Masonic Ave
- 840 Key Route Blvd
- 1236 Portland Ave
- 1498 Sonoma Ave
- 589 San Luis Rd
- 417 Evelyn Ave Unit 205
- 765 San Diego Rd
- 483 Boynton Ave
- 450 Vermont Ave
- 1741 Sonoma Ave
- 1036 Ramona Ave
- 305 Coronado St
- 655 Ensenada Ave
- 610 Colusa Ave
- 659 Ensenada Ave
- 638 Peralta Ave
- 626 Peralta Ave
- 620 Colusa Ave
- 646 Peralta Ave
- 604 Colusa Ave
- 620 Peralta Ave
- 663 Ensenada Ave
- 652 Peralta Ave
- 652 Ensenada Ave
- 624 Colusa Ave
- 660 Peralta Ave
- 660 Ensenada Ave
- 600 Colusa Ave
- 669 Ensenada Ave
- 608 Peralta Ave
- 666 Peralta Ave
- 641 Neilson St
Your Personal Tour Guide
Ask me questions while you tour the home.