Estimated Value: $562,000 - $609,000
5
Beds
2
Baths
1,372
Sq Ft
$429/Sq Ft
Est. Value
About This Home
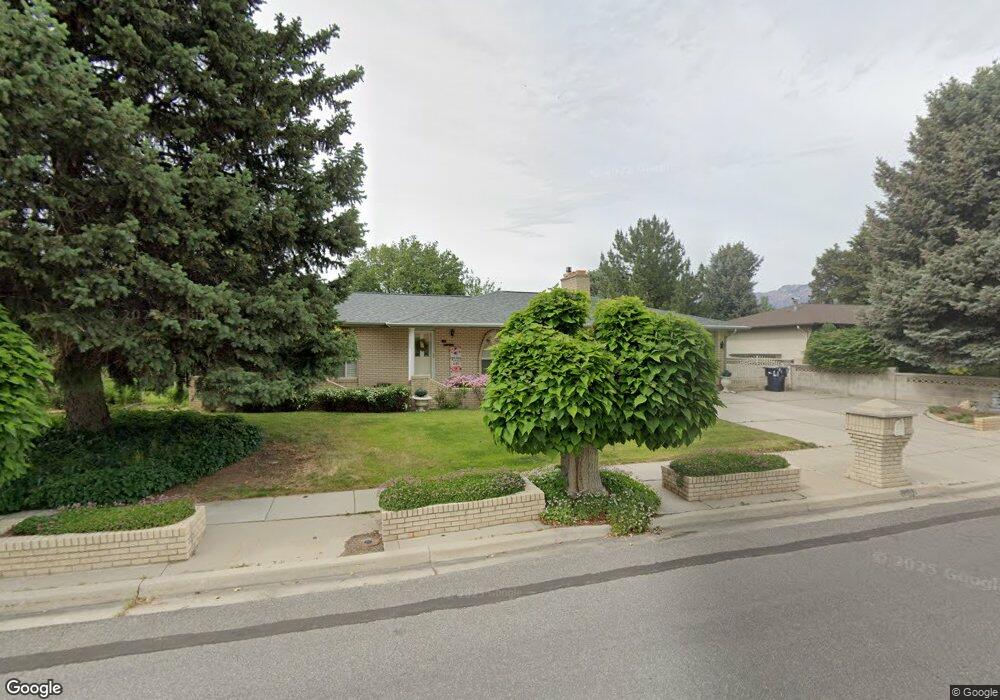
This home is located at 651 Floyd Dr, Sandy, UT 84070 and is currently estimated at $588,286, approximately $428 per square foot. 651 Floyd Dr is a home located in Salt Lake County with nearby schools including Mount Jordan Middle School and Jordan High.
Ownership History
Date
Name
Owned For
Owner Type
Purchase Details
Closed on
Aug 24, 2017
Sold by
Lever Richard Craig and Lever Carla
Bought by
Lever Richard Craig and Lever Carla
Current Estimated Value
Purchase Details
Closed on
Aug 7, 1997
Sold by
Lever Richard Craig and Lever Carla
Bought by
Lever Richard Craig and Lever Carla
Home Financials for this Owner
Home Financials are based on the most recent Mortgage that was taken out on this home.
Original Mortgage
$119,200
Outstanding Balance
$17,914
Interest Rate
7.57%
Estimated Equity
$570,372
Create a Home Valuation Report for This Property
The Home Valuation Report is an in-depth analysis detailing your home's value as well as a comparison with similar homes in the area
Home Values in the Area
Average Home Value in this Area
Purchase History
| Date | Buyer | Sale Price | Title Company |
|---|---|---|---|
| Lever Richard Craig | -- | None Available | |
| Lever Richard Craig | -- | -- |
Source: Public Records
Mortgage History
| Date | Status | Borrower | Loan Amount |
|---|---|---|---|
| Open | Lever Richard Craig | $119,200 |
Source: Public Records
Tax History
| Year | Tax Paid | Tax Assessment Tax Assessment Total Assessment is a certain percentage of the fair market value that is determined by local assessors to be the total taxable value of land and additions on the property. | Land | Improvement |
|---|---|---|---|---|
| 2025 | $2,985 | $568,500 | $196,300 | $372,200 |
| 2024 | $2,985 | $552,100 | $190,900 | $361,200 |
| 2023 | $2,389 | $440,500 | $183,400 | $257,100 |
| 2022 | $2,513 | $452,700 | $118,200 | $334,500 |
| 2021 | $2,255 | $345,800 | $90,700 | $255,100 |
| 2020 | $2,164 | $312,900 | $90,700 | $222,200 |
| 2019 | $2,044 | $288,000 | $85,600 | $202,400 |
| 2016 | $1,687 | $228,500 | $85,600 | $142,900 |
Source: Public Records
Map
Nearby Homes
- 566 E 9270 S
- 487 E 9270 S
- 9822 S Darin Dr
- 9218 S Laura Anne Way
- 362 E 9150 S
- 186 Brent Cir
- 807 E Whisper Cove Rd
- 918 Lazon Dr
- 9092 Enchanted Oak Ln
- 9101 S Enchanted Oak Ln
- 9587 S 1040 E
- 181 E 9180 S
- 10106 S Peony Way
- 1105 E Webster Dr
- 639 E Calnette Dr
- 8797 Green Way Unit 3
- 1138 E Quarry Stone Way
- 9633 S 1210 E
- 8732 S Oakwood Park Cr
- 8732 S 620 E
- 635 Floyd Dr
- 663 Floyd Dr
- 652 E Howard Dr
- 652 Howard Dr
- 664 Howard Dr
- 638 E Howard Dr
- 638 Howard Dr
- 650 Floyd Dr
- 636 E Floyd Dr
- 675 E Floyd Dr
- 675 Floyd Dr
- 621 Floyd Dr
- 662 Floyd Dr
- 621 E Floyd Dr
- 676 E Howard Dr Unit Basement Apartment
- 676 E Howard Dr
- 676 Howard Dr
- 628 E Floyd Dr
- 628 Howard Dr
- 628 Floyd Dr
Your Personal Tour Guide
Ask me questions while you tour the home.