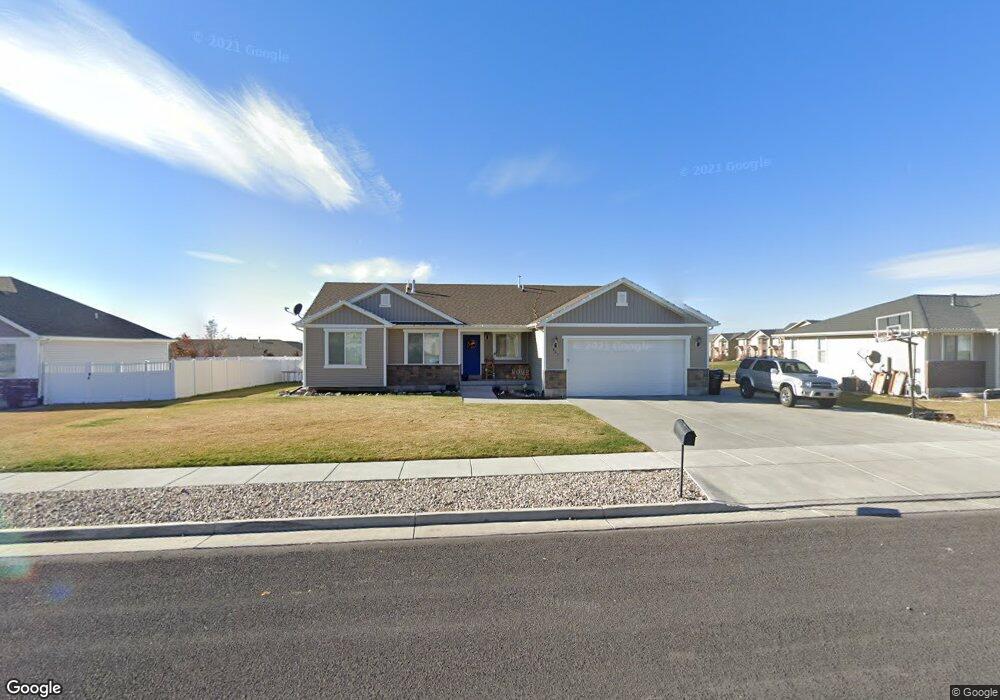
651 N 130 E Smithfield, UT 84335
Estimated Value: $434,000 - $545,000
6
Beds
3
Baths
2,780
Sq Ft
$179/Sq Ft
Est. Value
About This Home
This home is located at 651 N 130 E, Smithfield, UT 84335 and is currently estimated at $498,952, approximately $179 per square foot. 651 N 130 E is a home located in Cache County with nearby schools including Birch Creek School, North Cache Middle School, and White Pine Middle School.
Ownership History
Date
Name
Owned For
Owner Type
Purchase Details
Closed on
Feb 18, 2020
Sold by
Howe Jason R and Howe Heather
Bought by
Sawyer Dallas J and Sawyer Alicia
Current Estimated Value
Home Financials for this Owner
Home Financials are based on the most recent Mortgage that was taken out on this home.
Original Mortgage
$317,205
Outstanding Balance
$280,263
Interest Rate
3.6%
Mortgage Type
New Conventional
Estimated Equity
$218,689
Purchase Details
Closed on
Aug 14, 2015
Sold by
Kartchner Homes Inc
Bought by
Kartchner Inc
Home Financials for this Owner
Home Financials are based on the most recent Mortgage that was taken out on this home.
Original Mortgage
$204,000
Interest Rate
4.05%
Mortgage Type
Construction
Purchase Details
Closed on
May 29, 2015
Sold by
Hunter Meadows Development Company Inc
Bought by
Kartchner Homes Inc
Create a Home Valuation Report for This Property
The Home Valuation Report is an in-depth analysis detailing your home's value as well as a comparison with similar homes in the area
Home Values in the Area
Average Home Value in this Area
Purchase History
| Date | Buyer | Sale Price | Title Company |
|---|---|---|---|
| Sawyer Dallas J | -- | Metro National Title Assc | |
| Kartchner Inc | -- | Cache Title Logan | |
| Kartchner Homes Inc | -- | Northern Title Company |
Source: Public Records
Mortgage History
| Date | Status | Borrower | Loan Amount |
|---|---|---|---|
| Open | Sawyer Dallas J | $317,205 | |
| Previous Owner | Kartchner Inc | $204,000 |
Source: Public Records
Tax History
| Year | Tax Paid | Tax Assessment Tax Assessment Total Assessment is a certain percentage of the fair market value that is determined by local assessors to be the total taxable value of land and additions on the property. | Land | Improvement |
|---|---|---|---|---|
| 2025 | $1,891 | $253,175 | $0 | $0 |
| 2024 | $2,315 | $290,730 | $0 | $0 |
| 2023 | $2,428 | $288,310 | $0 | $0 |
| 2022 | $2,467 | $288,310 | $0 | $0 |
| 2021 | $1,956 | $349,175 | $69,500 | $279,675 |
| 2020 | $1,878 | $312,696 | $69,500 | $243,196 |
| 2019 | $1,845 | $292,836 | $49,640 | $243,196 |
| 2018 | $1,738 | $266,780 | $49,640 | $217,140 |
| 2017 | $1,682 | $141,040 | $0 | $0 |
| 2016 | $1,711 | $141,040 | $0 | $0 |
| 2015 | $605 | $49,640 | $0 | $0 |
| 2014 | $591 | $49,500 | $0 | $0 |
| 2013 | -- | $49,500 | $0 | $0 |
Source: Public Records
Map
Nearby Homes
Your Personal Tour Guide
Ask me questions while you tour the home.