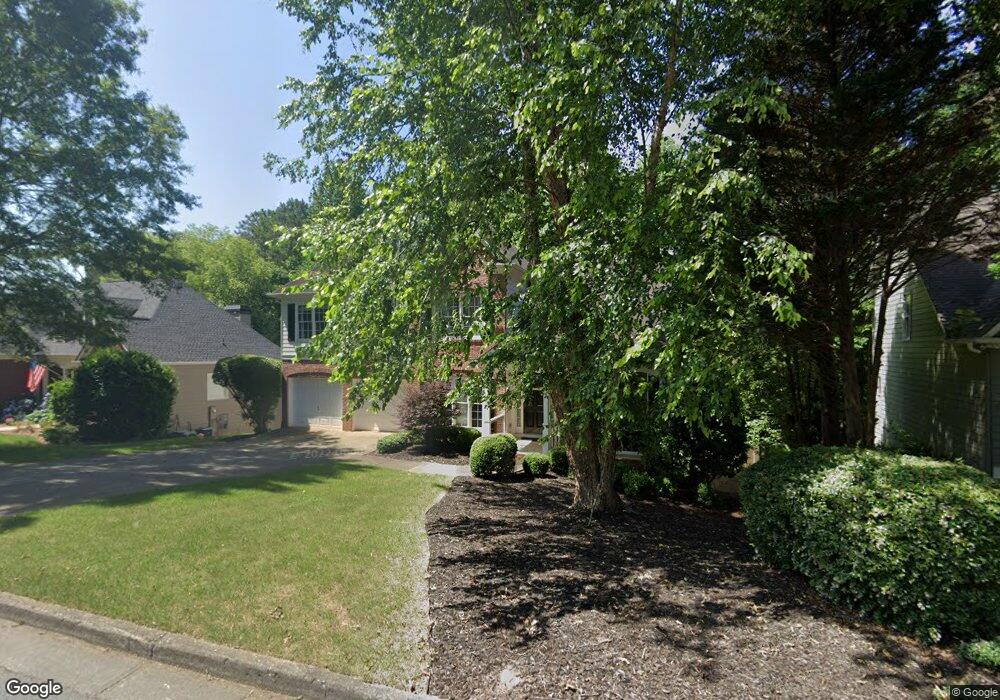
651 Steels Bridge Rd Canton, GA 30114
Sutallee NeighborhoodEstimated Value: $552,742 - $574,000
4
Beds
4
Baths
4,182
Sq Ft
$135/Sq Ft
Est. Value
About This Home
This home is located at 651 Steels Bridge Rd, Canton, GA 30114 and is currently estimated at $563,371, approximately $134 per square foot. 651 Steels Bridge Rd is a home located in Cherokee County with nearby schools including Sixes Elementary School, Freedom Middle School, and Woodstock High School.
Ownership History
Date
Name
Owned For
Owner Type
Purchase Details
Closed on
Jun 10, 2016
Sold by
Askew Spencer
Bought by
Fleming David
Current Estimated Value
Home Financials for this Owner
Home Financials are based on the most recent Mortgage that was taken out on this home.
Original Mortgage
$247,435
Outstanding Balance
$201,085
Interest Rate
4.4%
Mortgage Type
FHA
Estimated Equity
$362,286
Purchase Details
Closed on
Jul 18, 2003
Sold by
Barney Todd C and Barney Valerie H
Bought by
Askew Spencer
Home Financials for this Owner
Home Financials are based on the most recent Mortgage that was taken out on this home.
Original Mortgage
$199,500
Interest Rate
5.16%
Purchase Details
Closed on
Sep 14, 2000
Sold by
Raines Enterprises Inc
Bought by
Barney Todd C and Barney Valerie H
Home Financials for this Owner
Home Financials are based on the most recent Mortgage that was taken out on this home.
Original Mortgage
$184,400
Interest Rate
7.97%
Create a Home Valuation Report for This Property
The Home Valuation Report is an in-depth analysis detailing your home's value as well as a comparison with similar homes in the area
Home Values in the Area
Average Home Value in this Area
Purchase History
| Date | Buyer | Sale Price | Title Company |
|---|---|---|---|
| Fleming David | $252,000 | -- | |
| Askew Spencer | $210,000 | -- | |
| Barney Todd C | $204,900 | -- |
Source: Public Records
Mortgage History
| Date | Status | Borrower | Loan Amount |
|---|---|---|---|
| Open | Fleming David | $247,435 | |
| Previous Owner | Askew Spencer | $199,500 | |
| Previous Owner | Barney Todd C | $184,400 |
Source: Public Records
Tax History
| Year | Tax Paid | Tax Assessment Tax Assessment Total Assessment is a certain percentage of the fair market value that is determined by local assessors to be the total taxable value of land and additions on the property. | Land | Improvement |
|---|---|---|---|---|
| 2025 | $5,169 | $196,840 | $41,600 | $155,240 |
| 2024 | $4,796 | $184,560 | $38,000 | $146,560 |
| 2023 | $4,667 | $179,596 | $38,000 | $141,596 |
| 2022 | $4,217 | $160,436 | $35,200 | $125,236 |
| 2021 | $3,852 | $135,680 | $25,600 | $110,080 |
| 2020 | $3,439 | $121,040 | $25,600 | $95,440 |
| 2019 | $3,285 | $115,600 | $25,600 | $90,000 |
| 2018 | $3,038 | $106,280 | $24,000 | $82,280 |
| 2017 | $2,988 | $259,300 | $20,400 | $83,320 |
| 2016 | $2,755 | $242,400 | $20,400 | $76,560 |
| 2015 | $2,635 | $229,800 | $18,000 | $73,920 |
| 2014 | $2,562 | $223,200 | $18,000 | $71,280 |
Source: Public Records
Map
Nearby Homes
- 3021 Heatherbrook Trace
- 309 Laurel Glen Crossing
- 303 Walnut Hills Crossing
- 109 Hale View Cir
- 147 Henley St Unit 63
- 147 Henley St
- 155 Henley St Unit 61
- 155 Henley St
- 160 Henley St Unit 15
- 160 Henley St
- 164 Henley St
- 142 Henley St
- 142 Henley St Unit 11
- 1000 Delta Dr
- 315 William Gossett Dr
- 327 William Gossett Dr
- 265 Parc Dr
- 701 Redwood Pass
- 102 Springshade Ln
- 153 Birchwood Pass
- 651 Steel Bridge Rd Unit 2D
- 651 Steels Bridge Rd
- 653 Steels Bridge Rd
- 649 Steel Bridge Rd Unit 2D
- 653 Steel Bridge Rd Unit 2D
- 655 Steels Bridge Rd
- 647 Steel Bridge Rd
- 647 Steels Bridge Rd
- 650 Steels Bridge Rd
- 652 Steels Bridge Rd
- 652 Steels Bridge Rd Unit 2D
- 652 Steels Bridge Rd
- 652 Steel Bridge Rd Unit 2D
- 655 Steel Bridge Rd
- 650 Steel Bridge Rd Unit 2D
- 648 Steels Bridge Rd
- 648 Steel Bridge Rd
- 648 Steel Bridge Rd
- 645 Steel Bridge Rd Unit 2D
- 521 Autumn Walk
Your Personal Tour Guide
Ask me questions while you tour the home.