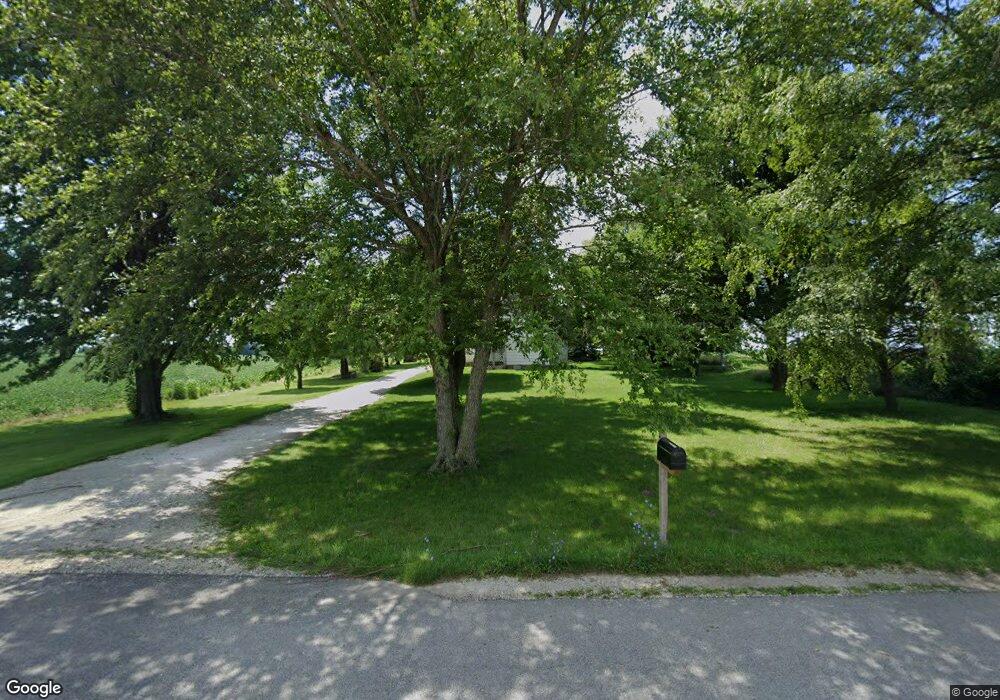
6510 E 400 N Fowler, IN 47944
Estimated Value: $225,000 - $254,000
4
Beds
2
Baths
2,012
Sq Ft
$118/Sq Ft
Est. Value
About This Home
This home is located at 6510 E 400 N, Fowler, IN 47944 and is currently estimated at $237,897, approximately $118 per square foot. 6510 E 400 N is a home located in Benton County with nearby schools including Tri-County Primary School, Tri-County Intermediate School, and Tri-County Jr.-Sr. High School.
Ownership History
Date
Name
Owned For
Owner Type
Purchase Details
Closed on
Dec 11, 2024
Sold by
Michael Alvin Cox and Michael Debra Suzanne
Bought by
Wealing Inc
Current Estimated Value
Home Financials for this Owner
Home Financials are based on the most recent Mortgage that was taken out on this home.
Original Mortgage
$244,000
Outstanding Balance
$230,535
Interest Rate
5.99%
Mortgage Type
New Conventional
Estimated Equity
$7,362
Purchase Details
Closed on
Apr 7, 2022
Sold by
Lynn Wealing Revocable Living Trust
Bought by
Wealing Chad Ryan and Wealing Lance Thomas
Create a Home Valuation Report for This Property
The Home Valuation Report is an in-depth analysis detailing your home's value as well as a comparison with similar homes in the area
Purchase History
| Date | Buyer | Sale Price | Title Company |
|---|---|---|---|
| Wealing Inc | -- | None Listed On Document | |
| Wealing Chad Ryan | -- | Manis Michael L |
Source: Public Records
Mortgage History
| Date | Status | Borrower | Loan Amount |
|---|---|---|---|
| Open | Wealing Inc | $244,000 |
Source: Public Records
Tax History
| Year | Tax Paid | Tax Assessment Tax Assessment Total Assessment is a certain percentage of the fair market value that is determined by local assessors to be the total taxable value of land and additions on the property. | Land | Improvement |
|---|---|---|---|---|
| 2025 | $1,995 | $182,600 | $31,000 | $151,600 |
| 2024 | $1,995 | $178,300 | $31,000 | $147,300 |
| 2023 | $1,782 | $170,100 | $21,300 | $148,800 |
| 2022 | $1,835 | $167,300 | $21,300 | $146,000 |
| 2021 | $1,456 | $128,200 | $21,300 | $106,900 |
| 2020 | $1,364 | $121,400 | $21,300 | $100,100 |
| 2019 | $934 | $86,500 | $21,300 | $65,200 |
| 2018 | $1,037 | $93,400 | $21,300 | $72,100 |
| 2017 | $960 | $92,600 | $21,300 | $71,300 |
| 2016 | $1,005 | $99,800 | $21,300 | $78,500 |
| 2014 | $750 | $78,800 | $20,900 | $57,900 |
| 2013 | $750 | $85,800 | $21,400 | $64,400 |
Source: Public Records
Map
Nearby Homes
- 1009 E 4th St
- 602 S Park Dr
- 909 E 7th St
- 909 E 8th St
- 305 N Lincoln Ave
- 201 S Grant Ave
- 902 E 8th St
- 601 E 3rd St
- 700 S Sharon Ave
- 303 N Jackson Ave
- 206 E Maple St
- 705 N Adams Ave
- 502 E 5th St
- 307 N Madison Ave
- 202 N Van Buren Ave
- 501 E 7th St
- 503 E 8th St
- 310 E 7th St
- 307 N Washington Ave
- 111 W 4th St
Your Personal Tour Guide
Ask me questions while you tour the home.