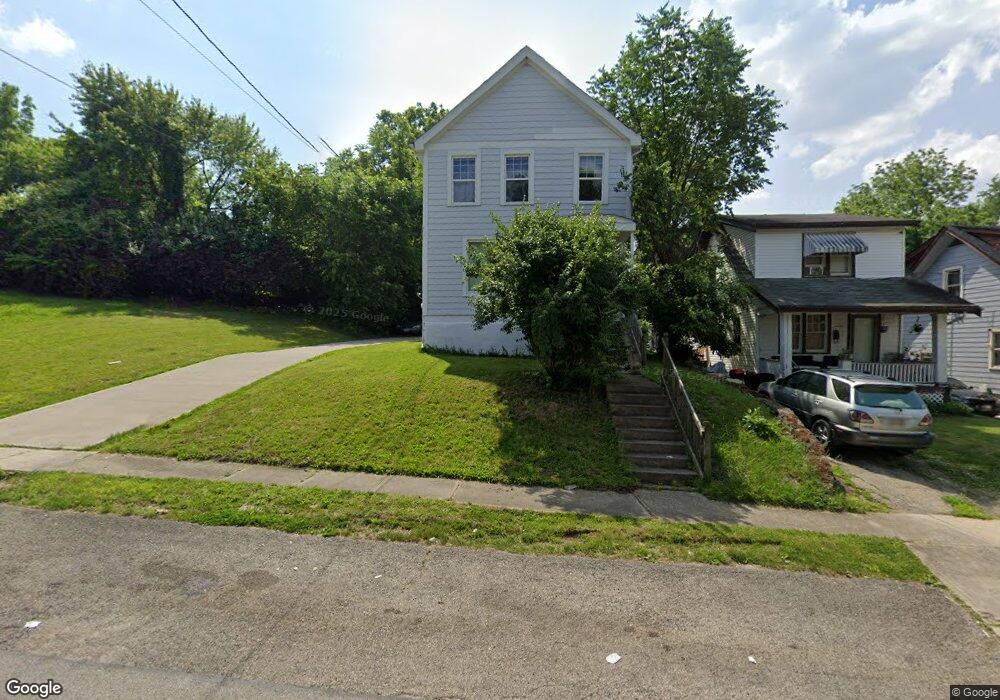
6511 Coleridge Ave Cincinnati, OH 45213
Kennedy Heights NeighborhoodEstimated Value: $176,000 - $257,000
3
Beds
1
Bath
1,728
Sq Ft
$125/Sq Ft
Est. Value
About This Home
This home is located at 6511 Coleridge Ave, Cincinnati, OH 45213 and is currently estimated at $216,278, approximately $125 per square foot. 6511 Coleridge Ave is a home located in Hamilton County with nearby schools including John P. Parker School, Shroder High School, and Clark Montessori High School.
Ownership History
Date
Name
Owned For
Owner Type
Purchase Details
Closed on
Jan 15, 2009
Sold by
Bolger John P
Bought by
Bolger John P
Current Estimated Value
Purchase Details
Closed on
Jul 18, 2008
Sold by
Ubs Real Estate Securities Inc
Bought by
Bolger John P
Purchase Details
Closed on
Nov 28, 2007
Sold by
Mundy Josephine and Mundy Ken
Bought by
Us Bank Na
Purchase Details
Closed on
Apr 29, 2005
Sold by
Hubbard Mark T and Hubbard Norma Jean
Bought by
Mundy Josephine and Mundy Ken
Home Financials for this Owner
Home Financials are based on the most recent Mortgage that was taken out on this home.
Original Mortgage
$88,000
Interest Rate
6.75%
Mortgage Type
Unknown
Create a Home Valuation Report for This Property
The Home Valuation Report is an in-depth analysis detailing your home's value as well as a comparison with similar homes in the area
Home Values in the Area
Average Home Value in this Area
Purchase History
| Date | Buyer | Sale Price | Title Company |
|---|---|---|---|
| Bolger John P | -- | Accutitle Agency Inc | |
| Bolger John P | $13,500 | Accutitle Agency Inc | |
| Ubs Real Estate Securities Inc | -- | None Available | |
| Us Bank Na | $64,000 | None Available | |
| Mundy Josephine | $110,000 | None Available |
Source: Public Records
Mortgage History
| Date | Status | Borrower | Loan Amount |
|---|---|---|---|
| Previous Owner | Mundy Josephine | $88,000 |
Source: Public Records
Tax History
| Year | Tax Paid | Tax Assessment Tax Assessment Total Assessment is a certain percentage of the fair market value that is determined by local assessors to be the total taxable value of land and additions on the property. | Land | Improvement |
|---|---|---|---|---|
| 2025 | $3,068 | $48,244 | $10,500 | $37,744 |
| 2023 | $3,069 | $48,244 | $10,500 | $37,744 |
| 2022 | $1,824 | $25,704 | $9,492 | $16,212 |
| 2021 | $1,789 | $25,704 | $9,492 | $16,212 |
| 2020 | $1,794 | $25,704 | $9,492 | $16,212 |
| 2019 | $1,745 | $22,747 | $8,400 | $14,347 |
| 2018 | $1,746 | $22,747 | $8,400 | $14,347 |
| 2017 | $1,682 | $22,747 | $8,400 | $14,347 |
| 2016 | $2,189 | $28,924 | $8,820 | $20,104 |
| 2015 | $1,957 | $28,924 | $8,820 | $20,104 |
| 2014 | $1,967 | $28,924 | $8,820 | $20,104 |
| 2013 | $1,906 | $27,545 | $8,400 | $19,145 |
Source: Public Records
Map
Nearby Homes
- 6501 Coleridge Ave
- 6508 Coleridge Ave
- 6460 Mchugh Place
- 3625 Zinsle Ave
- 6207 Coleridge Ave
- 3523 Mary Ann Ln
- 6218 Kennedy Ave
- 3824 Standish Ave
- 6201 Kennedy Ave
- 6256 Rogers Park Place
- 6221 Hedge Ave
- 3906 Standish Ave
- 3566 Amberacres Dr
- 3964 Zinsle Ave
- 6097 W Fordham Place
- 3962 S Fordham Place
- 3521 Section Rd
- 6656 Plainfield Rd
- 3921 Cedarwood Place
- 6454 Crestview Ave
- 6515 Coleridge Ave
- 6517 Coleridge Ave
- 6519 Coleridge Ave
- 6523 Coleridge Ave
- 6426 Mchugh Place
- 6425 Coleridge Ave
- 6422 Mchugh Place
- 6504 Coleridge Ave
- 6434 Mchugh Place
- 3685 Kirkup Ave
- 6418 Mchugh Place
- 6502 Coleridge Ave
- 6438 Mchugh Place
- 6507 Coleridge Ave
- 6601 Coleridge Ave
- 6419 Coleridge Ave
- 6410 Mchugh Place
- 3710 Kirkup Ave
- 6420 Coleridge Ave
- 6422 Coleridge Ave
Your Personal Tour Guide
Ask me questions while you tour the home.