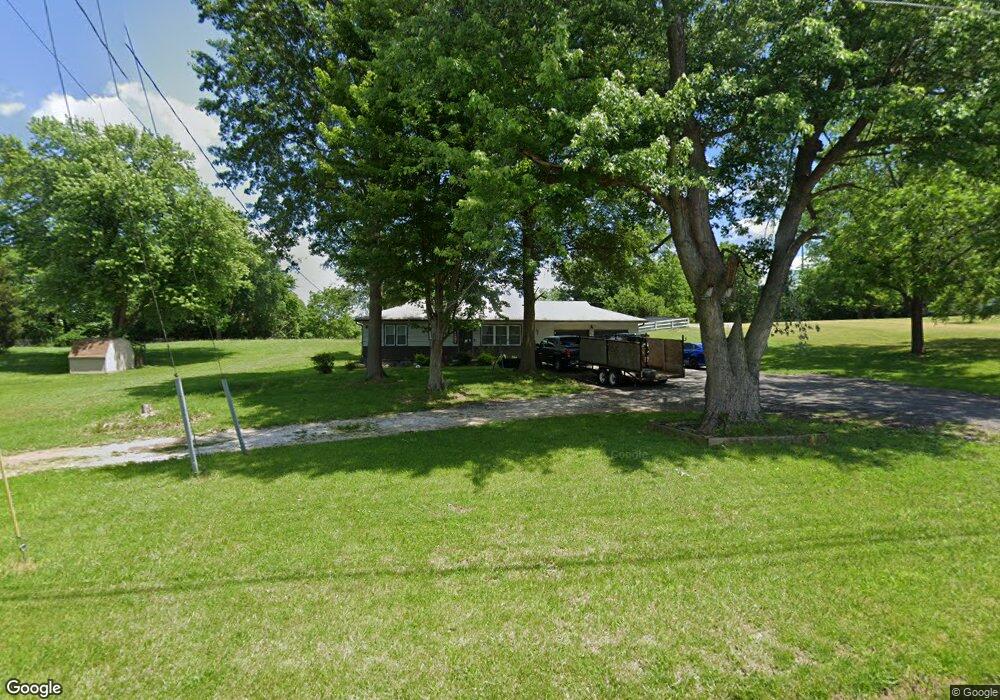
6511 Woodson Rd Raytown, MO 64133
Little Blue Valley NeighborhoodEstimated Value: $207,000 - $247,763
3
Beds
1
Bath
984
Sq Ft
$237/Sq Ft
Est. Value
About This Home
This home is located at 6511 Woodson Rd, Raytown, MO 64133 and is currently estimated at $232,941, approximately $236 per square foot. 6511 Woodson Rd is a home located in Jackson County with nearby schools including Norfleet Elementary School and Raytown Central Middle School.
Ownership History
Date
Name
Owned For
Owner Type
Purchase Details
Closed on
Apr 10, 2023
Sold by
Carranza Jose
Bought by
Curranco Benzamin
Current Estimated Value
Purchase Details
Closed on
Apr 13, 2022
Sold by
Continental Capital Corporation
Bought by
Carranza Benjamin and Carranza Jose
Purchase Details
Closed on
Mar 9, 2022
Sold by
Stidham and Trina
Bought by
Continental Capital Corporation
Purchase Details
Closed on
Jan 17, 2020
Sold by
Libeer Earl and Libeer Toni J
Bought by
Stidham Justin and Stidham Trina
Purchase Details
Closed on
Jan 10, 2020
Sold by
Libeer Toni J and Libeer Earl
Bought by
Stidham Justin and Stidham Trina
Purchase Details
Closed on
Mar 14, 2005
Sold by
Libeer Toni J and Libeer Earl
Bought by
Libeer Toni J and Libeer Earl
Home Financials for this Owner
Home Financials are based on the most recent Mortgage that was taken out on this home.
Original Mortgage
$65,000
Interest Rate
7.25%
Mortgage Type
Stand Alone Refi Refinance Of Original Loan
Create a Home Valuation Report for This Property
The Home Valuation Report is an in-depth analysis detailing your home's value as well as a comparison with similar homes in the area
Home Values in the Area
Average Home Value in this Area
Purchase History
| Date | Buyer | Sale Price | Title Company |
|---|---|---|---|
| Curranco Benzamin | -- | None Listed On Document | |
| Carranza Benjamin | -- | None Listed On Document | |
| Continental Capital Corporation | -- | Superior Title | |
| Continental Capital Corporation | -- | Superior Title | |
| Stidham Justin | -- | None Available | |
| Stidham Justin | -- | None Available | |
| Libeer Toni J | -- | Parkway Title Inc |
Source: Public Records
Mortgage History
| Date | Status | Borrower | Loan Amount |
|---|---|---|---|
| Previous Owner | Libeer Toni J | $65,000 |
Source: Public Records
Tax History Compared to Growth
Tax History
| Year | Tax Paid | Tax Assessment Tax Assessment Total Assessment is a certain percentage of the fair market value that is determined by local assessors to be the total taxable value of land and additions on the property. | Land | Improvement |
|---|---|---|---|---|
| 2025 | $2,752 | $32,163 | $16,053 | $16,110 |
| 2024 | $2,735 | $30,410 | $13,277 | $17,133 |
| 2023 | $2,735 | $30,410 | $6,565 | $23,845 |
| 2022 | $2,275 | $24,320 | $5,214 | $19,106 |
| 2021 | $2,275 | $24,320 | $5,214 | $19,106 |
| 2020 | $2,025 | $21,393 | $5,214 | $16,179 |
| 2019 | $1,987 | $21,393 | $5,214 | $16,179 |
| 2018 | $925,905 | $18,619 | $4,538 | $14,081 |
| 2017 | $12,978 | $18,619 | $4,538 | $14,081 |
| 2016 | $4,437 | $18,153 | $7,176 | $10,977 |
| 2014 | $1,673 | $18,153 | $7,176 | $10,977 |
Source: Public Records
Map
Nearby Homes
- 6322 Norwood Ct
- 6710 Woodson Rd
- 6407 Harvard Ave
- 11601 E 62nd St
- 6410 Harvard Ave
- 6828 Vermont Ave
- 11600 E 62nd St
- 6716 Sterling Ave
- 6317 Harvard Ave
- 6423 Harris Ave
- 12101 E 65th Ct
- 6812 Wildwood Dr
- 6727 Harvard Ave
- 11701 E 61st St
- 6711 Appleton Ave
- 6100 Englewood Ave
- 6716 Appleton Ave
- 11707 E 60th Terrace
- 12801 Rickey Rd
- 10800 Lakeview Rd
- 6507 Woodson Rd
- 6503 Woodson Rd
- 6508 Woodson Rd
- 6601 Woodson Rd
- 6425 Woodson Rd
- 6520 Woodson Rd
- 11815 Little Blue Rd
- 6609 Woodson Rd
- 6524 Woodson Rd
- 6504 Woodson Rd
- 11721 Little Blue Rd
- 11707 Little Blue Rd
- 11713 Little Blue Rd
- 6617 Woodson Rd
- 6600 Woodson Rd
- 6604 Woodson Rd
- 11701 Little Blue Rd
- 6424 Woodson Rd
- 6619 Woodson Rd
- 11516 E 66th Terrace