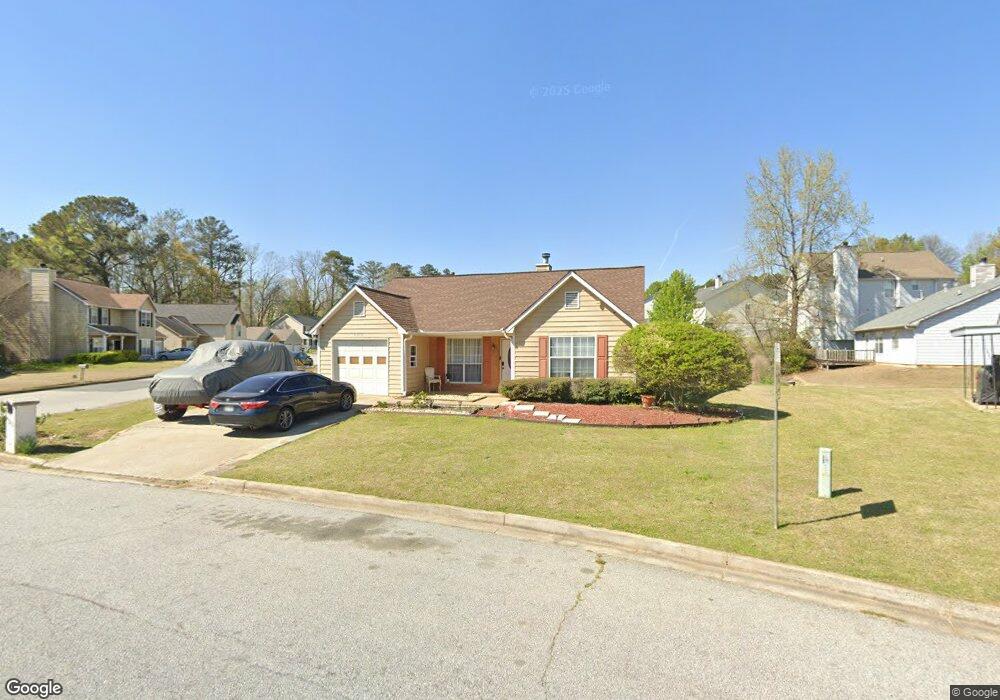
6512 Pine Bark Ct Unit 89 Morrow, GA 30260
Estimated Value: $200,000 - $290,000
3
Beds
2
Baths
1,400
Sq Ft
$171/Sq Ft
Est. Value
About This Home
This home is located at 6512 Pine Bark Ct Unit 89, Morrow, GA 30260 and is currently estimated at $239,105, approximately $170 per square foot. 6512 Pine Bark Ct Unit 89 is a home located in Clayton County with nearby schools including William M. Mcgarrah Elementary School, Rex Mill Middle School, and Mount Zion High School.
Ownership History
Date
Name
Owned For
Owner Type
Purchase Details
Closed on
Jan 31, 2022
Sold by
Sewell Jeffrey F
Bought by
Mendez Emely Jimenez
Current Estimated Value
Purchase Details
Closed on
Jul 24, 2018
Sold by
Barnes Lora A
Bought by
Mendez Sewell Jeffrey F and Mendez Neily
Home Financials for this Owner
Home Financials are based on the most recent Mortgage that was taken out on this home.
Original Mortgage
$114,000
Interest Rate
4.5%
Mortgage Type
New Conventional
Purchase Details
Closed on
Oct 29, 1993
Sold by
Secretary Of Va
Bought by
Barnes Lora A
Home Financials for this Owner
Home Financials are based on the most recent Mortgage that was taken out on this home.
Original Mortgage
$66,500
Interest Rate
5.75%
Mortgage Type
VA
Purchase Details
Closed on
Feb 2, 1993
Sold by
Rudzinski Michael J
Bought by
Bank South Mtg
Create a Home Valuation Report for This Property
The Home Valuation Report is an in-depth analysis detailing your home's value as well as a comparison with similar homes in the area
Home Values in the Area
Average Home Value in this Area
Purchase History
| Date | Buyer | Sale Price | Title Company |
|---|---|---|---|
| Mendez Emely Jimenez | $5,000 | -- | |
| Mendez Sewell Jeffrey F | $120,000 | -- | |
| Barnes Lora A | -- | -- | |
| Bank South Mtg | $61,805 | -- |
Source: Public Records
Mortgage History
| Date | Status | Borrower | Loan Amount |
|---|---|---|---|
| Previous Owner | Mendez Sewell Jeffrey F | $114,000 | |
| Previous Owner | Barnes Lora A | $66,500 |
Source: Public Records
Tax History
| Year | Tax Paid | Tax Assessment Tax Assessment Total Assessment is a certain percentage of the fair market value that is determined by local assessors to be the total taxable value of land and additions on the property. | Land | Improvement |
|---|---|---|---|---|
| 2025 | $3,100 | $89,960 | $8,000 | $81,960 |
| 2024 | $2,909 | $83,600 | $8,000 | $75,600 |
| 2023 | $2,574 | $71,280 | $8,000 | $63,280 |
| 2022 | $2,680 | $67,320 | $8,000 | $59,320 |
| 2021 | $2,190 | $54,480 | $8,000 | $46,480 |
| 2020 | $1,968 | $48,246 | $8,000 | $40,246 |
| 2019 | $1,446 | $44,692 | $6,400 | $38,292 |
| 2018 | $1,262 | $40,161 | $6,400 | $33,761 |
| 2017 | $830 | $29,469 | $6,400 | $23,069 |
| 2016 | $657 | $25,223 | $6,400 | $18,823 |
| 2015 | $656 | $0 | $0 | $0 |
| 2014 | $680 | $26,111 | $6,400 | $19,711 |
Source: Public Records
Map
Nearby Homes
- 6397 E Meyer Dr
- 2845 Heritage Ln
- 6486 Aquila Dr
- 2575 Stratford Ln
- 2613 Stratford Ln Unit 3
- 6584 Sleepy Hollow Ln
- 2617 Terrace Pkwy
- 2688 Heritage Ln
- 2681 Heritage Ln
- 2705 Heritage Ln
- 6485 Bobolink Ct
- 6389 Warbler Ct
- 6379 Warbler Ct
- 6387 Warbler Ct
- 6381 Warbler Ct
- 6346 Warbler Ct
- 6375 Warbler Ct
- 6266 Culver Dr
- 6348 Towhee Way
- 6354 Towhee Way
- 6512 Pine Bark Ct Unit 1
- 6508 Pine Bark Ct
- 6511 Mill Ct
- 6505 Mill Ct
- 6495 Mill Ct
- 6511 Pine Bark Ct
- 6511 Pine Bark Ct Unit 1
- 6504 Pine Bark Ct
- 2731 Mill Lake Way
- 2731 Mill Lake Way
- 6507 Pine Bark Ct
- 6485 Mill Ct
- 2741 Mill Lake Way Unit 1
- 2723 Mill Lake Way Unit 1
- 6498 Pine Bark Ct
- 2708 Mill Lake Way Unit 1
- 2750 Mill Lake Way
- 6503 Pine Bark Ct Unit 117
- 6503 Pine Bark Ct
- 6479 Mill Ct
Your Personal Tour Guide
Ask me questions while you tour the home.