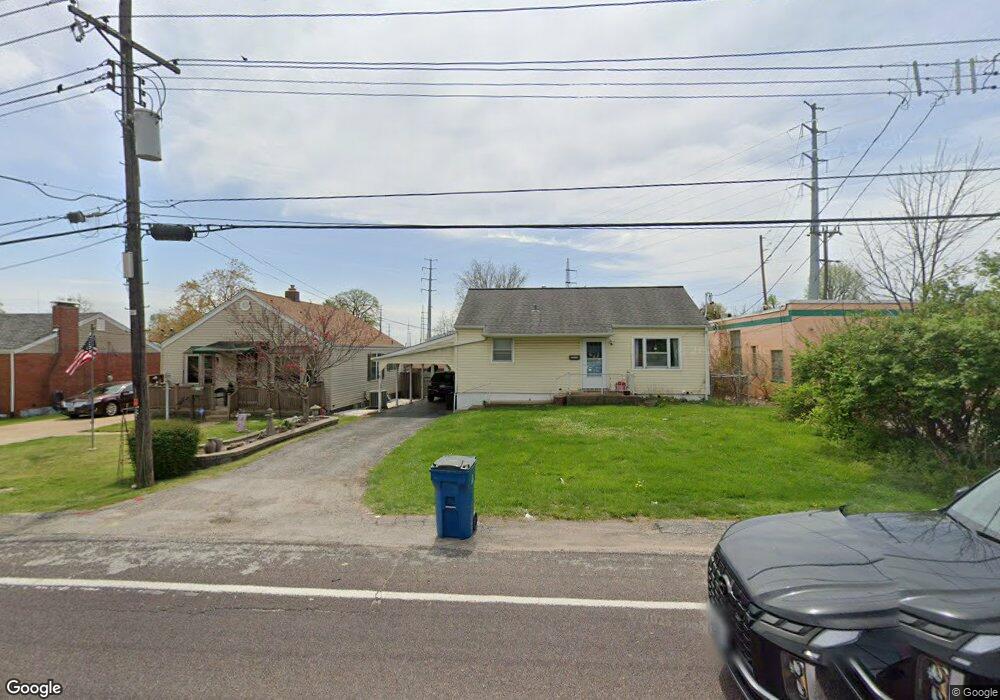
6512 Weber Rd Saint Louis, MO 63123
Estimated Value: $171,563 - $207,000
3
Beds
1
Bath
825
Sq Ft
$235/Sq Ft
Est. Value
About This Home
This home is located at 6512 Weber Rd, Saint Louis, MO 63123 and is currently estimated at $193,891, approximately $235 per square foot. 6512 Weber Rd is a home located in St. Louis County with nearby schools including Mesnier Primary School, Gotsch Intermediate School, and Rogers Middle School.
Ownership History
Date
Name
Owned For
Owner Type
Purchase Details
Closed on
Nov 26, 2012
Sold by
Property Purchasers Llc
Bought by
Property Dynamics Llc
Current Estimated Value
Purchase Details
Closed on
Mar 23, 2011
Sold by
Hollander Ruth E
Bought by
Property Purchasers Llc
Purchase Details
Closed on
Nov 30, 2007
Sold by
Hollander Douglas D and Hollander Susan M
Bought by
Hollander Ruth E
Purchase Details
Closed on
Sep 22, 2003
Sold by
Title Associates Inc
Bought by
Hollander Douglas and Hollander Ruth
Purchase Details
Closed on
Jun 9, 2003
Sold by
Arras Thomas S
Bought by
Title Associates Inc
Home Financials for this Owner
Home Financials are based on the most recent Mortgage that was taken out on this home.
Original Mortgage
$66,300
Interest Rate
5.65%
Mortgage Type
Purchase Money Mortgage
Create a Home Valuation Report for This Property
The Home Valuation Report is an in-depth analysis detailing your home's value as well as a comparison with similar homes in the area
Home Values in the Area
Average Home Value in this Area
Purchase History
| Date | Buyer | Sale Price | Title Company |
|---|---|---|---|
| Property Dynamics Llc | -- | None Available | |
| Property Purchasers Llc | -- | None Available | |
| Hollander Ruth E | -- | None Available | |
| Hollander Douglas | -- | -- | |
| Title Associates Inc | $74,000 | -- |
Source: Public Records
Mortgage History
| Date | Status | Borrower | Loan Amount |
|---|---|---|---|
| Previous Owner | Title Associates Inc | $66,300 |
Source: Public Records
Tax History
| Year | Tax Paid | Tax Assessment Tax Assessment Total Assessment is a certain percentage of the fair market value that is determined by local assessors to be the total taxable value of land and additions on the property. | Land | Improvement |
|---|---|---|---|---|
| 2025 | $2,165 | $33,140 | $13,090 | $20,050 |
| 2024 | $2,165 | $26,560 | $8,720 | $17,840 |
| 2023 | $2,094 | $26,560 | $8,720 | $17,840 |
| 2022 | $2,151 | $23,390 | $8,720 | $14,670 |
| 2021 | $1,964 | $23,390 | $8,720 | $14,670 |
| 2020 | $1,714 | $19,010 | $8,650 | $10,360 |
| 2019 | $1,711 | $19,010 | $8,650 | $10,360 |
| 2018 | $1,436 | $14,060 | $6,040 | $8,020 |
| 2017 | $1,427 | $14,060 | $6,040 | $8,020 |
| 2016 | $1,343 | $14,060 | $4,500 | $9,560 |
Source: Public Records
Map
Nearby Homes
- 6421 Judson Ave
- 8501 Palmetto Dr
- 8520 Ava Dr
- 8942 Eden Ave
- 6714 Colony Acres Dr
- 6321 Sheppard Dr
- 6722 Colony Acres Dr
- 6723 Colony Acres Dr
- 6209 Bixby Ave
- 8628 Charlton Ln
- 9320 Sterling Place
- 9225 Pavia Ave
- 9406 Mackenzie Rd
- 8200 New Hampshire Ave
- 9319 Lenard Ct
- 9018 Vasel Dr
- 6901 General Sherman Ln
- 8016 Wynwood Dr
- 9740 Bexley Station Dr Unit 7G
- 9134 Niger Dr
- 6510 Weber Rd
- 6508 Weber Rd
- 6504 Weber Rd
- 6514 Weber Rd
- 8553 Palmetto Dr
- 6625 Weber Rd
- 6633 Weber Rd
- 8601 Ivy Ave
- 8603 Ivy Ave
- 8607 Ivy Ave
- 8549 Palmetto Dr
- 8615 Ivy Ave
- 8619 Ivy Ave
- 8545 Palmetto Dr
- 85308566 Webshire Ln
- 8716 New Hampshire Ave
- 8701 Ivy Ave
- 8710 New Hampshire Ave
- 8722 New Hampshire Ave
- 8548 Palmetto Dr
Your Personal Tour Guide
Ask me questions while you tour the home.