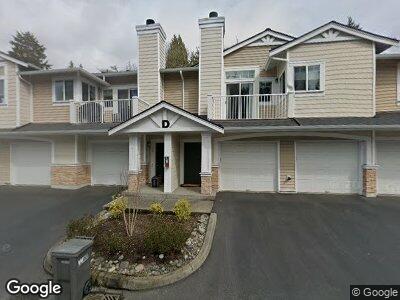
6515 134th Place SE Unit J3 Snohomish, WA 98296
Snohomish Cascade NeighborhoodEstimated Value: $458,000 - $475,000
2
Beds
2
Baths
1,088
Sq Ft
$428/Sq Ft
Est. Value
About This Home
This home is located at 6515 134th Place SE Unit J3, Snohomish, WA 98296 and is currently estimated at $465,914, approximately $428 per square foot. 6515 134th Place SE Unit J3 is a home located in Snohomish County with nearby schools including Little Cedars Elementary School, Valley View Middle School, and Glacier Peak High School.
Ownership History
Date
Name
Owned For
Owner Type
Purchase Details
Closed on
Mar 25, 2021
Sold by
Wilson Lois T
Bought by
Wilson Lois T and Wilson Kimberly A
Current Estimated Value
Purchase Details
Closed on
Jun 3, 2004
Sold by
Gray Anna Christine
Bought by
Wilson Lois T
Purchase Details
Closed on
Nov 17, 2001
Sold by
Gray David Scott
Bought by
Gray Anna Christine
Home Financials for this Owner
Home Financials are based on the most recent Mortgage that was taken out on this home.
Original Mortgage
$150,340
Interest Rate
6.63%
Mortgage Type
FHA
Purchase Details
Closed on
Dec 9, 1999
Sold by
S C Carriage Llc
Bought by
Gray Anna C
Home Financials for this Owner
Home Financials are based on the most recent Mortgage that was taken out on this home.
Original Mortgage
$150,340
Interest Rate
7.96%
Mortgage Type
FHA
Create a Home Valuation Report for This Property
The Home Valuation Report is an in-depth analysis detailing your home's value as well as a comparison with similar homes in the area
Home Values in the Area
Average Home Value in this Area
Purchase History
| Date | Buyer | Sale Price | Title Company |
|---|---|---|---|
| Wilson Lois T | -- | None Available | |
| Wilson Lois T | $165,000 | Chicago Title | |
| Gray Anna Christine | -- | -- | |
| Gray Anna C | $154,990 | Chicago Title Insurance Co |
Source: Public Records
Mortgage History
| Date | Status | Borrower | Loan Amount |
|---|---|---|---|
| Previous Owner | Gray Anna Christine | $150,340 | |
| Previous Owner | Gray Anna C | $150,340 |
Source: Public Records
Tax History Compared to Growth
Tax History
| Year | Tax Paid | Tax Assessment Tax Assessment Total Assessment is a certain percentage of the fair market value that is determined by local assessors to be the total taxable value of land and additions on the property. | Land | Improvement |
|---|---|---|---|---|
| 2025 | $318 | $427,500 | $123,500 | $304,000 |
| 2024 | $318 | $440,500 | $116,600 | $323,900 |
| 2023 | $304 | $339,000 | $100,500 | $238,500 |
| 2022 | $367 | $320,000 | $85,000 | $235,000 |
| 2020 | $405 | $315,000 | $80,000 | $235,000 |
| 2019 | $423 | $255,000 | $80,000 | $175,000 |
| 2018 | $432 | $209,000 | $17,000 | $192,000 |
| 2017 | $465 | $200,000 | $17,000 | $183,000 |
| 2016 | $468 | $171,000 | $16,500 | $154,500 |
| 2015 | $476 | $160,000 | $15,000 | $145,000 |
| 2013 | $448 | $140,500 | $15,000 | $125,500 |
Source: Public Records
Map
Nearby Homes
- 6515 134th Place SE Unit A3
- 6521 Cascade Dr SE
- 13405 68th Ave SE Unit 54
- 6617 133rd Place SE Unit 76
- 6622 141st St SE
- 5931 140th St SE
- 14007 69th Dr SE Unit D2
- 14007 69th Dr SE Unit R3
- 14007 69th Dr SE Unit R2
- 14302 63rd Dr SE
- 13919 Silver Firs Dr
- 5719 136th Place SE
- 14205 Silver Firs Dr
- 5731 131st Place SE
- 5607 134th Place SE Unit A
- 6503 146th St SE
- 13606 56th Ave SE
- 13313 74th Ave SE
- 14204 57th Dr SE
- 12916 54th Ave SE
- 6515 134th Place SE Unit K8
- 6515 134th Place SE Unit K7
- 6515 134th Place SE Unit K6
- 6515 134th Place SE Unit K5
- 6515 134th Place SE Unit K4
- 6515 134th Place SE Unit K2
- 6515 134th Place SE Unit K1
- 6515 134th Place SE Unit J8
- 6515 134th Place SE Unit J7
- 6515 134th Place SE Unit J6
- 6515 134th Place SE Unit J5
- 6515 134th Place SE Unit J4
- 6515 134th Place SE Unit J3
- 6515 134th Place SE Unit J2
- 6515 134th Place SE Unit J1
- 6515 134th Place SE Unit I6
- 6515 134th Place SE Unit I5
- 6515 134th Place SE Unit I4
- 6515 134th Place SE Unit I3
- 6515 134th Place SE Unit I2