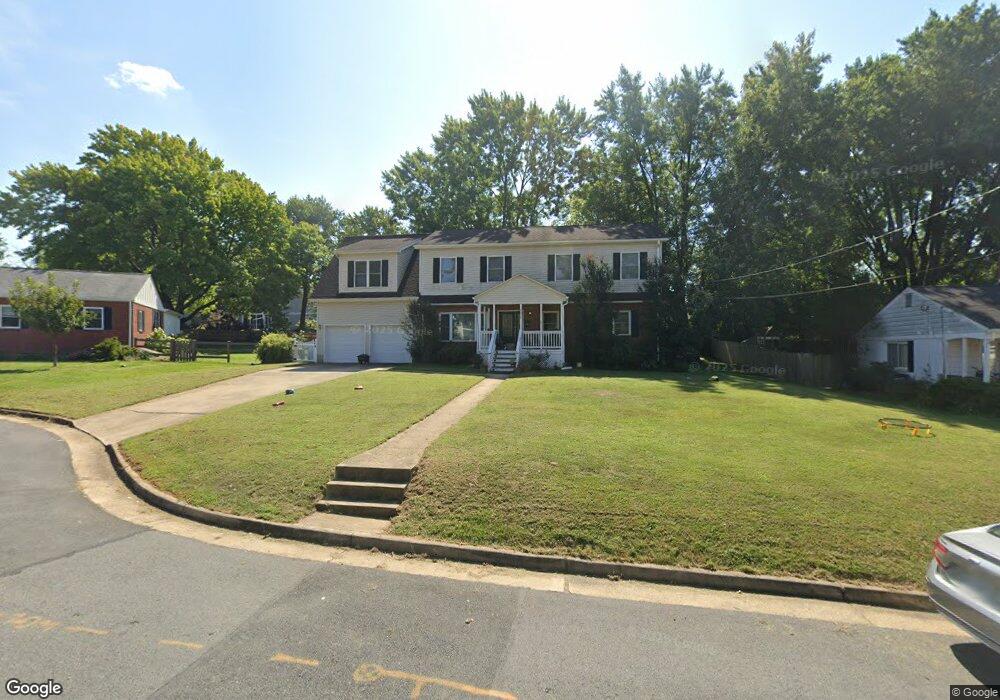
6515 32nd St Falls Church, VA 22046
Estimated Value: $1,362,000 - $1,853,000
6
Beds
6
Baths
3,942
Sq Ft
$400/Sq Ft
Est. Value
About This Home
This home is located at 6515 32nd St, Falls Church, VA 22046 and is currently estimated at $1,575,681, approximately $399 per square foot. 6515 32nd St is a home located in Fairfax County with nearby schools including Haycock Elementary School, Longfellow Middle School, and St. James Catholic School.
Ownership History
Date
Name
Owned For
Owner Type
Purchase Details
Closed on
Aug 28, 2020
Sold by
Courey Marc Bennett and Courey Nicole Moran
Bought by
Courey Marc Bennett and Courey Nicole Moran
Current Estimated Value
Purchase Details
Closed on
Nov 22, 2011
Sold by
Bargerstock John O
Bought by
Courey Marc B
Purchase Details
Closed on
May 21, 2002
Sold by
Ashwood Robert
Bought by
Lafoon Jennifer
Home Financials for this Owner
Home Financials are based on the most recent Mortgage that was taken out on this home.
Original Mortgage
$250,000
Interest Rate
7.01%
Mortgage Type
New Conventional
Create a Home Valuation Report for This Property
The Home Valuation Report is an in-depth analysis detailing your home's value as well as a comparison with similar homes in the area
Home Values in the Area
Average Home Value in this Area
Purchase History
| Date | Buyer | Sale Price | Title Company |
|---|---|---|---|
| Courey Marc Bennett | -- | None Available | |
| Courey Marc B | $812,500 | -- | |
| Lafoon Jennifer | $315,000 | -- |
Source: Public Records
Mortgage History
| Date | Status | Borrower | Loan Amount |
|---|---|---|---|
| Previous Owner | Lafoon Jennifer | $250,000 |
Source: Public Records
Tax History Compared to Growth
Tax History
| Year | Tax Paid | Tax Assessment Tax Assessment Total Assessment is a certain percentage of the fair market value that is determined by local assessors to be the total taxable value of land and additions on the property. | Land | Improvement |
|---|---|---|---|---|
| 2025 | $13,662 | $1,184,450 | $536,000 | $648,450 |
| 2024 | $13,662 | $1,156,300 | $541,000 | $615,300 |
| 2023 | $12,382 | $1,075,280 | $501,000 | $574,280 |
| 2022 | $12,512 | $1,072,590 | $442,000 | $630,590 |
| 2021 | $12,443 | $1,039,990 | $442,000 | $597,990 |
| 2020 | $12,183 | $1,009,790 | $433,000 | $576,790 |
| 2019 | $11,418 | $946,340 | $433,000 | $513,340 |
| 2018 | $10,353 | $900,280 | $416,000 | $484,280 |
| 2017 | $9,709 | $820,010 | $414,000 | $406,010 |
| 2016 | $9,641 | $815,990 | $414,000 | $401,990 |
| 2015 | $8,890 | $780,530 | $394,000 | $386,530 |
| 2014 | $8,883 | $781,620 | $386,000 | $395,620 |
Source: Public Records
Map
Nearby Homes
- 2302 Westmoreland St
- 6601 Gordon Ave
- 3019 N Tuckahoe St
- 2231 N Tuckahoe St
- 2828 N Van Buren St
- 6613 Fisher Ave
- 2300 Meridian St
- 2221 Orchid Dr
- 6607 29th St N
- 6616 Fisher Ave
- 3013 N Toronto St
- 6587 29th St N
- 6703 Hallwood Ave
- 2125 Hilltop Place
- 6528 36th St N
- 6707 Hallwood Ave
- 2632 N Sycamore St
- 2123 Natahoa Ct
- 6449 Orland St
- 2136 Powhatan St