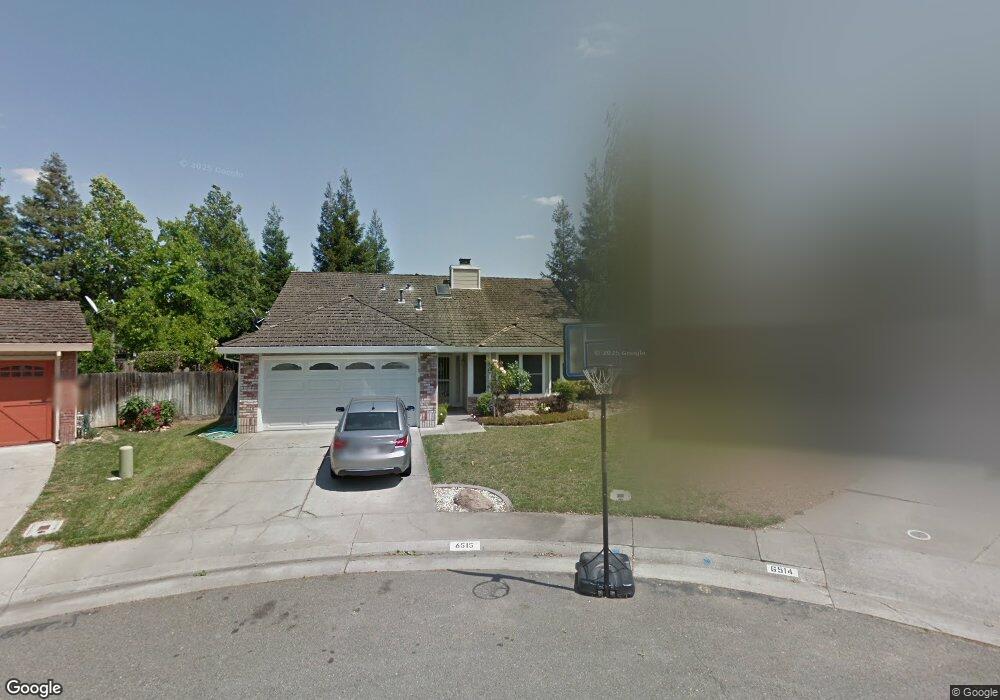
6515 Dunedin Place Elk Grove, CA 95758
North West Elk Grove NeighborhoodEstimated Value: $513,000 - $568,000
3
Beds
2
Baths
1,661
Sq Ft
$325/Sq Ft
Est. Value
About This Home
This home is located at 6515 Dunedin Place, Elk Grove, CA 95758 and is currently estimated at $539,639, approximately $324 per square foot. 6515 Dunedin Place is a home located in Sacramento County with nearby schools including John Ehrhardt Elementary School, Harriet G. Eddy Middle School, and Laguna Creek High School.
Ownership History
Date
Name
Owned For
Owner Type
Purchase Details
Closed on
Jul 25, 2005
Sold by
Cole Doralee and Ingram Flora
Bought by
Cole Doralee
Current Estimated Value
Home Financials for this Owner
Home Financials are based on the most recent Mortgage that was taken out on this home.
Original Mortgage
$344,250
Outstanding Balance
$171,395
Interest Rate
4.95%
Mortgage Type
Purchase Money Mortgage
Estimated Equity
$368,244
Purchase Details
Closed on
Aug 22, 2002
Sold by
Podwinski Nicholas J and Podwinski Beverly A
Bought by
Cole Doralee and Ingram Flora
Home Financials for this Owner
Home Financials are based on the most recent Mortgage that was taken out on this home.
Original Mortgage
$243,559
Interest Rate
6.24%
Mortgage Type
FHA
Purchase Details
Closed on
Sep 18, 2000
Sold by
Podwinski Joseph John
Bought by
Podwinski Nicholas J and Podwinski Beverley A
Home Financials for this Owner
Home Financials are based on the most recent Mortgage that was taken out on this home.
Original Mortgage
$128,000
Interest Rate
8.07%
Create a Home Valuation Report for This Property
The Home Valuation Report is an in-depth analysis detailing your home's value as well as a comparison with similar homes in the area
Home Values in the Area
Average Home Value in this Area
Purchase History
| Date | Buyer | Sale Price | Title Company |
|---|---|---|---|
| Cole Doralee | -- | Chicago Title Co | |
| Cole Doralee | $246,000 | Fidelity National Title Co | |
| Podwinski Nicholas J | -- | Commonwealth Land Title Co |
Source: Public Records
Mortgage History
| Date | Status | Borrower | Loan Amount |
|---|---|---|---|
| Open | Cole Doralee | $344,250 | |
| Closed | Cole Doralee | $243,559 | |
| Previous Owner | Podwinski Nicholas J | $128,000 |
Source: Public Records
Tax History Compared to Growth
Tax History
| Year | Tax Paid | Tax Assessment Tax Assessment Total Assessment is a certain percentage of the fair market value that is determined by local assessors to be the total taxable value of land and additions on the property. | Land | Improvement |
|---|---|---|---|---|
| 2025 | $8,411 | $407,022 | $132,264 | $274,758 |
| 2024 | $8,411 | $399,042 | $129,671 | $269,371 |
| 2023 | $7,982 | $391,219 | $127,129 | $264,090 |
| 2022 | $7,544 | $383,549 | $124,637 | $258,912 |
| 2021 | $7,075 | $376,030 | $122,194 | $253,836 |
| 2020 | $6,856 | $328,964 | $106,900 | $222,064 |
| 2019 | $5,961 | $307,444 | $99,907 | $207,537 |
| 2018 | $5,566 | $295,620 | $96,065 | $199,555 |
| 2017 | $5,481 | $276,281 | $89,781 | $186,500 |
| 2016 | $4,892 | $255,817 | $83,131 | $172,686 |
| 2015 | $4,546 | $232,562 | $75,574 | $156,988 |
| 2014 | $2,630 | $219,398 | $71,296 | $148,102 |
Source: Public Records
Map
Nearby Homes
- 6925 Risata Way
- 6465 Laguna Mirage Ln
- 6009 Greybridge Ct
- 6348 Laguna Mirage Ln
- 7013 Sandy Souza Way
- 0 Elliott Ranch Rd Unit 225131105
- 8939 Generations Ct
- 7213 Tiant Way
- 7212 Tiant Way
- 6809 Harvest Oak Ct
- 5501 Big Creek Way
- 6131 Jacinto Ave
- 7105 Fall Way
- 5161 Saint Edwards Way
- 6024 Deepdale Way
- 9105 Turnbull Ct
- 1312 Winterhart St
- 8741 Noble Fir Ln
- 6512 Laguna Park Dr
- 5817 Sparrow Hawk Ct
- 6514 Dunedin Place
- 6511 Dunedin Place
- 6507 Dunedin Place
- 6510 Dunedin Place
- 6506 Dunedin Place
- 6503 Dunedin Place
- 6413 Alpinespring Way
- 9060 Paso Robles Way
- 6409 Alpinespring Way
- 9056 Paso Robles Way
- 6408 Alpinespring Way
- 6428 Silver Hawk Way
- 6424 Silver Hawk Way
- 6432 Silver Hawk Way
- 6420 Silver Hawk Way
- 6500 Silver Hawk Ct
- 6405 Alpinespring Way
- 6416 Silver Hawk Way
- 6504 Silver Hawk Ct
- 6404 Alpinespring Way