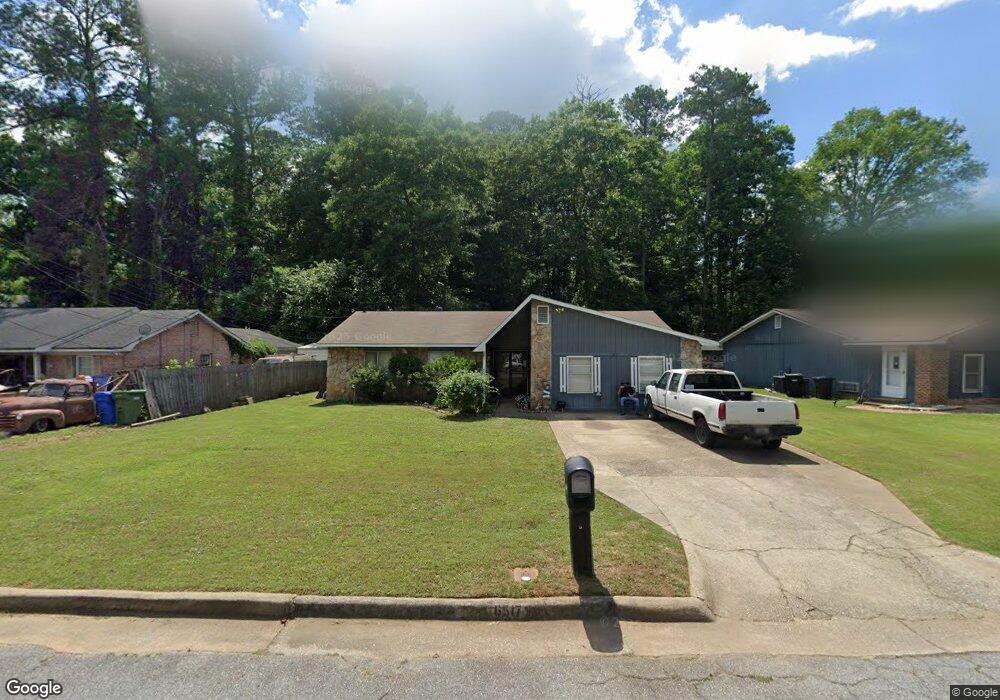
6517 Charter Oaks Cir Columbus, GA 31909
Northern Columbus NeighborhoodEstimated Value: $144,000 - $236,000
3
Beds
3
Baths
1,869
Sq Ft
$111/Sq Ft
Est. Value
About This Home
This home is located at 6517 Charter Oaks Cir, Columbus, GA 31909 and is currently estimated at $206,775, approximately $110 per square foot. 6517 Charter Oaks Cir is a home located in Muscogee County with nearby schools including Blanchard Elementary School, Blackmon Road Middle School, and Shaw High School.
Ownership History
Date
Name
Owned For
Owner Type
Purchase Details
Closed on
Feb 18, 2025
Sold by
Between Property Dynamx Llc
Bought by
Harrison Tekel
Current Estimated Value
Purchase Details
Closed on
Apr 30, 2024
Sold by
Bank Of New York and Cit Mortgage Loan Trust
Bought by
Dynamx Llc
Home Financials for this Owner
Home Financials are based on the most recent Mortgage that was taken out on this home.
Original Mortgage
$165,000
Interest Rate
7.1%
Mortgage Type
Construction
Purchase Details
Closed on
Jan 2, 2024
Sold by
Watkins William J and Watkins Dianna
Bought by
Cit Mortgage Loan Trust and Bank Of New York
Create a Home Valuation Report for This Property
The Home Valuation Report is an in-depth analysis detailing your home's value as well as a comparison with similar homes in the area
Home Values in the Area
Average Home Value in this Area
Purchase History
| Date | Buyer | Sale Price | Title Company |
|---|---|---|---|
| Harrison Tekel | -- | None Listed On Document | |
| Harrison Tekel | -- | None Listed On Document | |
| Dynamx Llc | $126,000 | None Listed On Document | |
| Cit Mortgage Loan Trust | $11,544 | None Listed On Document |
Source: Public Records
Mortgage History
| Date | Status | Borrower | Loan Amount |
|---|---|---|---|
| Previous Owner | Dynamx Llc | $165,000 |
Source: Public Records
Tax History Compared to Growth
Tax History
| Year | Tax Paid | Tax Assessment Tax Assessment Total Assessment is a certain percentage of the fair market value that is determined by local assessors to be the total taxable value of land and additions on the property. | Land | Improvement |
|---|---|---|---|---|
| 2025 | $2,544 | $64,992 | $10,212 | $54,780 |
| 2024 | $2,999 | $76,616 | $10,212 | $66,404 |
| 2023 | $3,018 | $76,616 | $10,212 | $66,404 |
| 2022 | $2,481 | $60,760 | $10,212 | $50,548 |
| 2021 | $807 | $54,764 | $10,212 | $44,552 |
| 2020 | $807 | $54,764 | $10,212 | $44,552 |
| 2019 | $812 | $54,764 | $10,212 | $44,552 |
| 2018 | $812 | $54,764 | $10,212 | $44,552 |
| 2017 | $816 | $54,764 | $10,212 | $44,552 |
| 2016 | $820 | $36,886 | $6,421 | $30,465 |
| 2015 | $822 | $36,886 | $6,421 | $30,465 |
| 2014 | $824 | $36,886 | $6,421 | $30,465 |
| 2013 | -- | $36,886 | $6,421 | $30,465 |
Source: Public Records
Map
Nearby Homes
- 6500 Charter Oaks Cir
- 4627 Wimbish Ct
- 4715 Teak Dr
- 5011 Montego Dr
- 6630 Lemans Ln
- 6736 Charter Oaks Cir
- 5041 Montego Dr
- 4417 Sibley St
- 5042 Foxfire Dr
- 5045 Old Post Rd
- 6136 Morningside Dr
- 4245 N Oaks Dr
- 209 Plum Ct
- 4454 Weems Rd
- 6137 Stoneway Dr
- 6717 Moon Cir
- 6158 Arrington Dr
- 5378 Misty Ln
- 4202 Cheshire Bridge Rd
- 5028 Warm Springs Rd
- 6527 Charter Oaks Cir
- 6511 Charter Oaks Cir
- 0 Charter Oaks Cir Unit 7225917
- 0 Charter Oaks Cir
- 6535 Charter Oaks Cir
- 6505 Charter Oaks Cir
- 4632 Randall Dr
- 6518 Charter Oaks Cir
- 4639 Wimbish Ct
- 6512 Charter Oaks Cir
- 4626 Randall Dr
- 6543 Charter Oaks Cir
- 6524 Charter Oaks Cir
- 6501 Charter Oaks Cir
- 4 Randall Ct
- 6532 Charter Oaks Cir
- 6506 Charter Oaks Cir
- 6538 Charter Oaks Cir
- 4633 Wimbish Ct
- 4620 Randall Dr