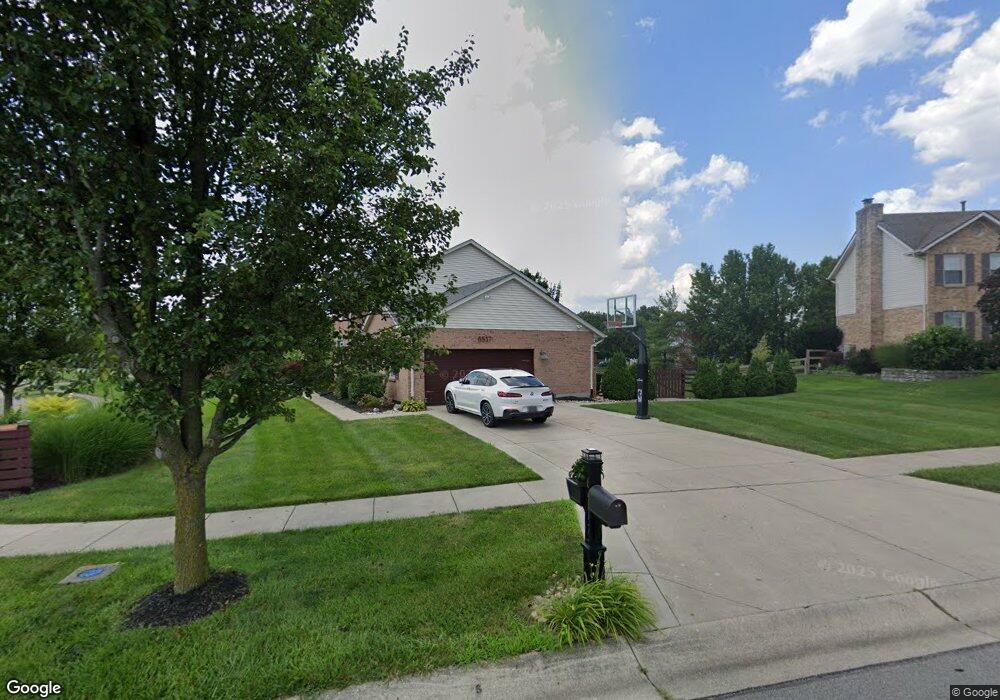
6517 Cumberland Lake Ct Unit 5380 Hamilton, OH 45011
Fairfield Township NeighborhoodEstimated Value: $432,632 - $474,000
4
Beds
3
Baths
2,542
Sq Ft
$176/Sq Ft
Est. Value
About This Home
This home is located at 6517 Cumberland Lake Ct Unit 5380, Hamilton, OH 45011 and is currently estimated at $448,658, approximately $176 per square foot. 6517 Cumberland Lake Ct Unit 5380 is a home located in Butler County with nearby schools including Fairfield North Elementary School, Creekside Middle School, and Fairfield Senior High School.
Ownership History
Date
Name
Owned For
Owner Type
Purchase Details
Closed on
Mar 8, 2022
Sold by
Unknown
Bought by
Dubose Jemar D and Dubose Melanie N
Current Estimated Value
Purchase Details
Closed on
Apr 25, 2005
Sold by
Alvarez Alan A and Alvarez Nancy Jane
Bought by
Dubose Jemar D
Home Financials for this Owner
Home Financials are based on the most recent Mortgage that was taken out on this home.
Original Mortgage
$178,800
Interest Rate
4.75%
Mortgage Type
New Conventional
Purchase Details
Closed on
Apr 26, 1999
Sold by
Oaktree Homes Of Butler County Inc
Bought by
Alvarez Alan A and Alvarez Nancy Jane
Home Financials for this Owner
Home Financials are based on the most recent Mortgage that was taken out on this home.
Original Mortgage
$100,000
Interest Rate
7.04%
Mortgage Type
Balloon
Create a Home Valuation Report for This Property
The Home Valuation Report is an in-depth analysis detailing your home's value as well as a comparison with similar homes in the area
Home Values in the Area
Average Home Value in this Area
Purchase History
| Date | Buyer | Sale Price | Title Company |
|---|---|---|---|
| Dubose Jemar D | -- | -- | |
| Dubose Jemar D | $223,500 | -- | |
| Alvarez Alan A | $182,225 | -- |
Source: Public Records
Mortgage History
| Date | Status | Borrower | Loan Amount |
|---|---|---|---|
| Previous Owner | Dubose Jemar D | $178,800 | |
| Previous Owner | Alvarez Alan A | $100,000 | |
| Closed | Dubose Jemar D | $44,700 |
Source: Public Records
Tax History Compared to Growth
Tax History
| Year | Tax Paid | Tax Assessment Tax Assessment Total Assessment is a certain percentage of the fair market value that is determined by local assessors to be the total taxable value of land and additions on the property. | Land | Improvement |
|---|---|---|---|---|
| 2024 | $4,895 | $130,600 | $17,440 | $113,160 |
| 2023 | $4,852 | $134,920 | $17,440 | $117,480 |
| 2022 | $4,526 | $89,090 | $17,440 | $71,650 |
| 2021 | $4,048 | $85,030 | $17,440 | $67,590 |
| 2020 | $4,189 | $85,030 | $17,440 | $67,590 |
| 2019 | $6,826 | $72,630 | $16,010 | $56,620 |
| 2018 | $4,076 | $72,630 | $16,010 | $56,620 |
| 2017 | $4,120 | $72,630 | $16,010 | $56,620 |
| 2016 | $3,869 | $64,690 | $16,010 | $48,680 |
| 2015 | $3,804 | $64,690 | $16,010 | $48,680 |
| 2014 | $3,315 | $64,690 | $16,010 | $48,680 |
| 2013 | $3,315 | $61,910 | $16,010 | $45,900 |
Source: Public Records
Map
Nearby Homes
- 3420 Lakewood Ct
- 6384 Fox Lake Ct
- 6312 Sara Ct
- 3259 Drew Dr
- 6416 Sara Ct
- 3601 Winter Hill Dr
- 6172 Spring Lake Dr
- 3571 Dawn Dr
- 6645 Ashby Ct
- 3657 Charfield Ln
- 6478 Holly Ln
- 6241 Shady Creek Way
- 3530 Oak Spring Dr
- 3153 Schaffers Run Ct
- 3170 Schaffers Run Ct
- 3080 Shoreacres
- 3462 Elbert Dr
- 0 Princeton Unit 1824961
- 6059 Creekside Way
- 6731 Forest Hill Ln
- 6517 Cumberland Lake Ct
- 6507 Cumberland Lake Ct
- 6466 Windlake Ct
- 6446 Windlake Ct
- 6426 Windlake Ct
- 6473 Lakewood Dr
- 6483 Lakewood Dr
- 6497 Cumberland Lake Ct
- 6516 Cumberland Lake Ct
- 6416 Windlake Ct
- 6463 Lakewood Dr
- 6506 Cumberland Lake Ct
- 6493 Lakewood Dr
- 6487 Cumberland Lake Ct
- 6406 Windlake Ct
- 6453 Lakewood Dr
- 6496 Cumberland Lake Ct
- 6465 Windlake Ct
- 6497 Lakerun Ct
- 6467 Cumberland Lake Ct