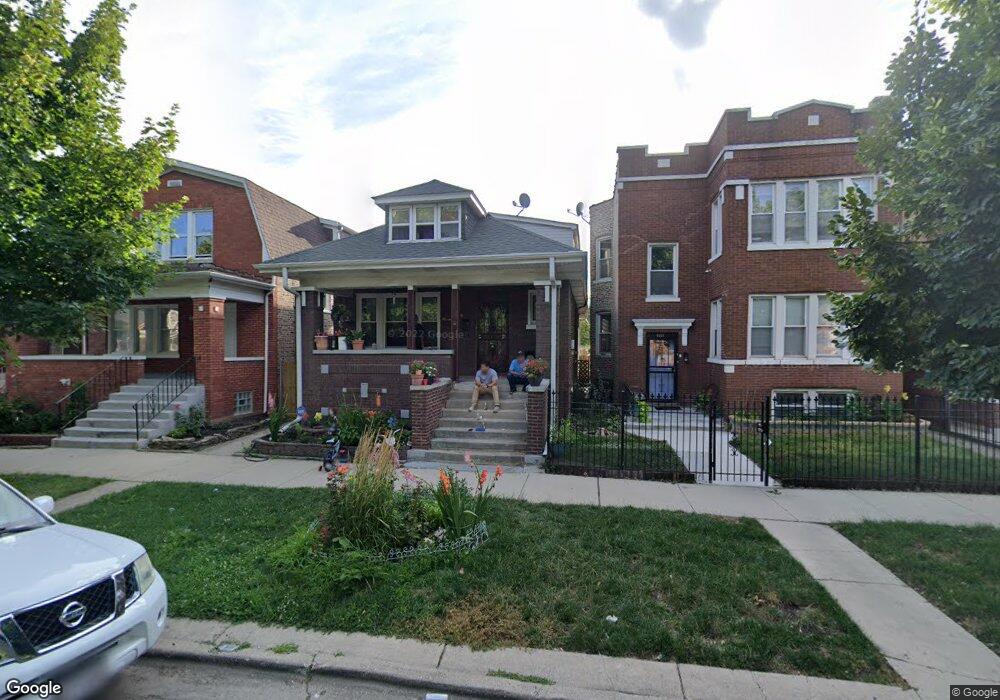
6518 S Artesian Ave Chicago, IL 60629
Marquette Park NeighborhoodEstimated Value: $203,000 - $244,000
5
Beds
3
Baths
1,150
Sq Ft
$193/Sq Ft
Est. Value
About This Home
This home is located at 6518 S Artesian Ave, Chicago, IL 60629 and is currently estimated at $222,111, approximately $193 per square foot. 6518 S Artesian Ave is a home located in Cook County with nearby schools including Claremont Academy Elementary School, Marquette School of Excellence, and Gage Park High School.
Ownership History
Date
Name
Owned For
Owner Type
Purchase Details
Closed on
Jul 19, 2017
Sold by
Weathers Prentis E
Bought by
Roman Ines
Current Estimated Value
Home Financials for this Owner
Home Financials are based on the most recent Mortgage that was taken out on this home.
Original Mortgage
$112,917
Outstanding Balance
$94,372
Interest Rate
4.37%
Mortgage Type
FHA
Estimated Equity
$127,739
Purchase Details
Closed on
Oct 25, 2000
Sold by
Baker Alvia
Bought by
Weathers Prentis and Braddock Shirley A
Home Financials for this Owner
Home Financials are based on the most recent Mortgage that was taken out on this home.
Original Mortgage
$84,390
Interest Rate
7.87%
Purchase Details
Closed on
Mar 29, 2000
Sold by
Rundle Edwin A
Bought by
Baker Alvia
Home Financials for this Owner
Home Financials are based on the most recent Mortgage that was taken out on this home.
Original Mortgage
$48,000
Interest Rate
8.31%
Create a Home Valuation Report for This Property
The Home Valuation Report is an in-depth analysis detailing your home's value as well as a comparison with similar homes in the area
Home Values in the Area
Average Home Value in this Area
Purchase History
| Date | Buyer | Sale Price | Title Company |
|---|---|---|---|
| Roman Ines | $150,000 | Stewart Title | |
| Weathers Prentis | $87,000 | First American Title | |
| Baker Alvia | $48,000 | Ticor Title Insurance |
Source: Public Records
Mortgage History
| Date | Status | Borrower | Loan Amount |
|---|---|---|---|
| Open | Roman Ines | $112,917 | |
| Previous Owner | Weathers Prentis | $84,390 | |
| Previous Owner | Baker Alvia | $48,000 |
Source: Public Records
Tax History
| Year | Tax Paid | Tax Assessment Tax Assessment Total Assessment is a certain percentage of the fair market value that is determined by local assessors to be the total taxable value of land and additions on the property. | Land | Improvement |
|---|---|---|---|---|
| 2025 | $1,630 | $16,000 | $1,875 | $14,125 |
| 2024 | $1,630 | $16,000 | $1,875 | $14,125 |
| 2023 | $1,568 | $11,000 | $3,000 | $8,000 |
| 2022 | $1,568 | $11,000 | $3,000 | $8,000 |
| 2021 | $1,542 | $11,000 | $3,000 | $8,000 |
| 2020 | $2,210 | $9,858 | $3,000 | $6,858 |
| 2019 | $2,240 | $11,077 | $3,000 | $8,077 |
| 2018 | $2,202 | $11,077 | $3,000 | $8,077 |
| 2017 | $1,728 | $11,349 | $2,625 | $8,724 |
| 2016 | $1,785 | $11,349 | $2,625 | $8,724 |
| 2015 | $1,472 | $11,349 | $2,625 | $8,724 |
| 2014 | $1,189 | $9,660 | $2,437 | $7,223 |
| 2013 | $1,151 | $9,660 | $2,437 | $7,223 |
Source: Public Records
Map
Nearby Homes
- 6431 S Maplewood Ave
- 6458 S Claremont Ave
- 6633 S Campbell Ave
- 6423 S Claremont Ave
- 6607 S Oakley Ave
- 6355 S Oakley Ave
- 6445 S Washtenaw Ave
- 6648 S Oakley Ave
- 6608 S Bell Ave
- 6715 S Claremont Ave
- 6733 S Maplewood Ave
- 6734 S Maplewood Ave
- 6722 S Oakley Ave
- 6621 S Fairfield Ave
- 6716 S Bell Ave
- 6217 S Claremont Ave
- 6221 S Talman Ave
- 6545 S Hamilton Ave
- 6621 S California Ave
- 6526 S Hoyne Ave
- 6522 S Artesian Ave
- 6516 S Artesian Ave
- 6526 S Artesian Ave
- 6512 S Artesian Ave
- 6510 S Artesian Ave
- 6510 S Artesian Ave Unit 1
- 6528 S Artesian Ave
- 6530 S Artesian Ave
- 6506 S Artesian Ave
- 6519 S Campbell Ave
- 6523 S Campbell Ave
- 6517 S Campbell Ave
- 6504 S Artesian Ave
- 6532 S Artesian Ave
- 6525 S Campbell Ave
- 6513 S Campbell Ave
- 6529 S Campbell Ave
- 6509 S Campbell Ave
- 6523 S Artesian Ave
- 6515 S Artesian Ave
Your Personal Tour Guide
Ask me questions while you tour the home.