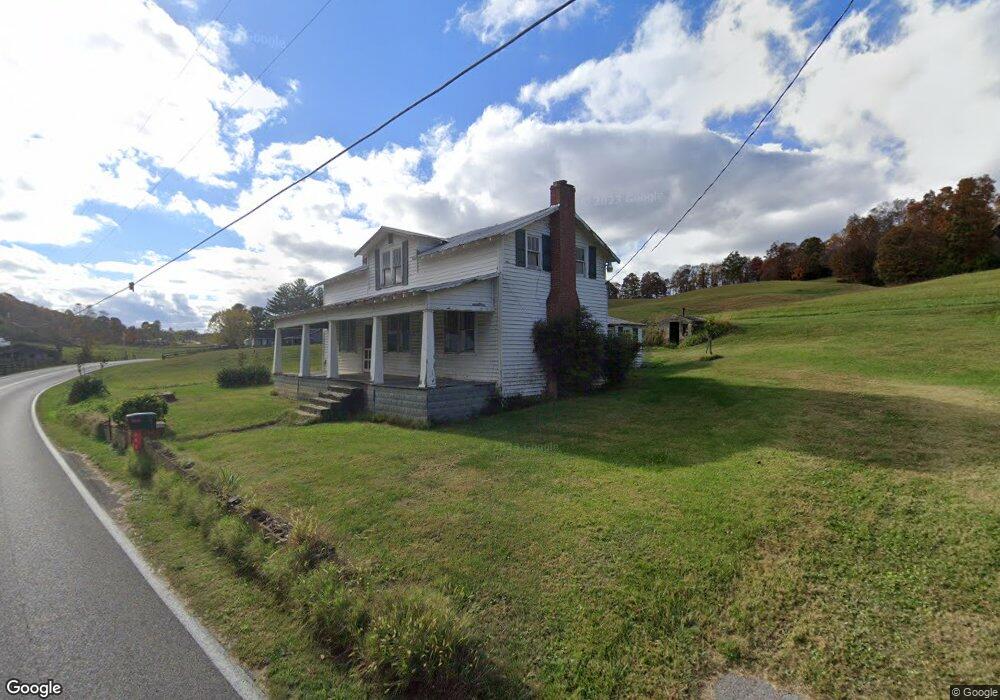
652 Fordtown Rd Fall Branch, TN 37656
Estimated Value: $272,823 - $374,000
--
Bed
1
Bath
1,360
Sq Ft
$231/Sq Ft
Est. Value
About This Home
This home is located at 652 Fordtown Rd, Fall Branch, TN 37656 and is currently estimated at $313,706, approximately $230 per square foot. 652 Fordtown Rd is a home located in Washington County with nearby schools including Fall Branch Elementary School and Daniel Boone High School.
Ownership History
Date
Name
Owned For
Owner Type
Purchase Details
Closed on
Dec 16, 2016
Sold by
Baird Kenitha Dillow
Bought by
Dillow Danny Thomas and Dillow Patsy Crawford
Current Estimated Value
Purchase Details
Closed on
Aug 12, 2015
Sold by
Mildred Dillow Pauline Estate
Bought by
Baird Kenitha Dillow and Smith Cynthia Faye
Purchase Details
Closed on
Jul 11, 2014
Sold by
Chatman Beverly W
Bought by
Dillow Pauline Depew
Purchase Details
Closed on
Aug 6, 2013
Sold by
Dillow Pauline Depew
Bought by
Chatman Beverly W
Home Financials for this Owner
Home Financials are based on the most recent Mortgage that was taken out on this home.
Original Mortgage
$175,000
Interest Rate
4.48%
Mortgage Type
Commercial
Purchase Details
Closed on
Feb 5, 2001
Sold by
Dillow Pauline
Bought by
Dearman Kenitha Ann
Create a Home Valuation Report for This Property
The Home Valuation Report is an in-depth analysis detailing your home's value as well as a comparison with similar homes in the area
Home Values in the Area
Average Home Value in this Area
Purchase History
| Date | Buyer | Sale Price | Title Company |
|---|---|---|---|
| Dillow Danny Thomas | -- | -- | |
| Baird Kenitha Dillow | $50,000 | -- | |
| Baird Kenitha Dillow | -- | -- | |
| Dillow Pauline Depew | $135,000 | -- | |
| Chatman Beverly W | $175,000 | -- | |
| Dillow Danny Thomas | -- | -- | |
| Baird Kenitha Dillow | -- | -- | |
| Dearman Kenitha Ann | -- | -- |
Source: Public Records
Mortgage History
| Date | Status | Borrower | Loan Amount |
|---|---|---|---|
| Previous Owner | Dillow Danny Thomas | $175,000 |
Source: Public Records
Tax History Compared to Growth
Tax History
| Year | Tax Paid | Tax Assessment Tax Assessment Total Assessment is a certain percentage of the fair market value that is determined by local assessors to be the total taxable value of land and additions on the property. | Land | Improvement |
|---|---|---|---|---|
| 2024 | $413 | $24,150 | $13,350 | $10,800 |
| 2022 | $334 | $15,550 | $10,075 | $5,475 |
| 2021 | $334 | $15,550 | $10,075 | $5,475 |
| 2020 | $334 | $15,550 | $10,075 | $5,475 |
| 2019 | $289 | $15,550 | $10,075 | $5,475 |
| 2018 | $289 | $12,150 | $10,200 | $1,950 |
| 2017 | $289 | $12,150 | $10,200 | $1,950 |
| 2016 | $357 | $36,925 | $34,975 | $1,950 |
| 2015 | $297 | $15,000 | $13,050 | $1,950 |
| 2014 | $297 | $15,000 | $13,050 | $1,950 |
Source: Public Records
Map
Nearby Homes
- 545 Fordtown Rd
- 480 Fordtown Rd
- 00 Rd
- Tbd Tranquil Ct
- 106 Davis Rd
- 205 Fordtown Rd
- 1415 Highway 93
- Lot 19 Steepleview Ct
- Tr 1 Joe R McCrary Rd
- Lot 15 Steepleview Ct
- Lot 14 Steepleview Ct
- Lot 13 Larkins Farm Dr
- 1238 Fordtown Rd
- Lot 9 Larkins Farm Dr
- 689 Painter Rd
- 110 Rhetts Way
- 1332 Harmony Rd
- Lot 10 Larkins Farm Dr
- 140 Hulse Rd
- 104 Kincheloe Rd
- 630 Fordtown Rd
- 660 Fordtown Rd
- 628 Fordtown Rd
- 612 Fordtown Rd
- 609 Fordtown Rd
- 604 Fordtown Rd
- 675 Fordtown Rd
- 596 Fordtown Rd
- 854 Fordtown Rd
- 583 Fordtown Rd
- 152 Link Rd
- 194 Link Rd
- 153 Link Rd
- LOT #5 Fordtown Rd
- 1245 Fordtown Rd
- LOT #7 Fordtown Rd
- 0 Fordtown Rd
- TBD Fordtown Rd
- 537 Fordtown Rd
- 529 Fordtown Rd