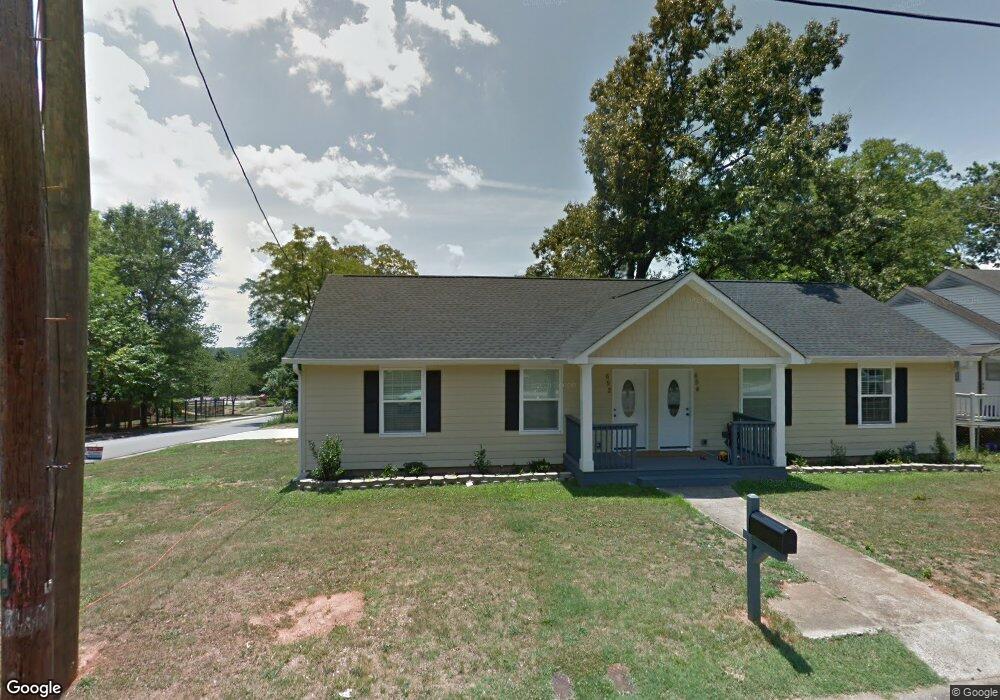
652 Frasier St SE Unit 652/654 Marietta, GA 30060
Victory NeighborhoodEstimated Value: $321,000 - $436,000
4
Beds
2
Baths
1,620
Sq Ft
$235/Sq Ft
Est. Value
About This Home
This home is located at 652 Frasier St SE Unit 652/654, Marietta, GA 30060 and is currently estimated at $380,939, approximately $235 per square foot. 652 Frasier St SE Unit 652/654 is a home located in Cobb County with nearby schools including Park Street Elementary School, Marietta Sixth Grade Academy, and Marietta Middle School.
Ownership History
Date
Name
Owned For
Owner Type
Purchase Details
Closed on
Mar 11, 2020
Sold by
Gupta Renu
Bought by
Polaris Hospitality Llc
Current Estimated Value
Home Financials for this Owner
Home Financials are based on the most recent Mortgage that was taken out on this home.
Original Mortgage
$175,000
Outstanding Balance
$154,987
Interest Rate
3.5%
Mortgage Type
New Conventional
Estimated Equity
$225,952
Purchase Details
Closed on
Jul 8, 2016
Sold by
Ayala Elmer L
Bought by
Polaris Hospitality Llc
Purchase Details
Closed on
Oct 26, 2015
Sold by
Watts Frank N
Bought by
Ayala Elmer L
Purchase Details
Closed on
Sep 2, 2009
Sold by
Bank Of Ny Mellon
Bought by
Watts Frank and Watts Frank N
Purchase Details
Closed on
Jul 7, 2009
Sold by
Ortiz Juan
Bought by
Bank Of Ny Mellon
Create a Home Valuation Report for This Property
The Home Valuation Report is an in-depth analysis detailing your home's value as well as a comparison with similar homes in the area
Home Values in the Area
Average Home Value in this Area
Purchase History
| Date | Buyer | Sale Price | Title Company |
|---|---|---|---|
| Polaris Hospitality Llc | -- | None Available | |
| Gupta Renu | -- | None Available | |
| Polaris Hospitality Llc | $178,000 | -- | |
| Ayala Elmer L | $70,000 | -- | |
| Watts Frank | $48,500 | -- | |
| Bank Of Ny Mellon | $141,189 | -- |
Source: Public Records
Mortgage History
| Date | Status | Borrower | Loan Amount |
|---|---|---|---|
| Open | Gupta Renu | $175,000 |
Source: Public Records
Tax History Compared to Growth
Tax History
| Year | Tax Paid | Tax Assessment Tax Assessment Total Assessment is a certain percentage of the fair market value that is determined by local assessors to be the total taxable value of land and additions on the property. | Land | Improvement |
|---|---|---|---|---|
| 2024 | $1,049 | $124,000 | $28,000 | $96,000 |
| 2023 | $1,183 | $139,828 | $28,000 | $111,828 |
| 2022 | $951 | $112,360 | $28,000 | $84,360 |
| 2021 | $631 | $73,428 | $12,000 | $61,428 |
| 2020 | $631 | $73,428 | $12,000 | $61,428 |
| 2019 | $631 | $73,428 | $12,000 | $61,428 |
| 2018 | $631 | $73,428 | $12,000 | $61,428 |
| 2017 | $472 | $68,576 | $12,000 | $56,576 |
| 2016 | $190 | $27,544 | $8,000 | $19,544 |
| 2015 | $170 | $22,716 | $8,000 | $14,716 |
| 2014 | $149 | $19,220 | $0 | $0 |
Source: Public Records
Map
Nearby Homes
- 652 Frasier St SE
- 646 Frasier St SE Unit 648
- 655 Frasier St Marietta Ga Unit 655/15
- 640 Frasier St SE Unit 642
- 655 Frasier St SE Unit B
- 655 Frasier St SE Unit 655/15
- 655 Frasier St SE Unit A&B
- 655 Frasier St SE
- 655 Frasier St SE Unit A
- 662 Frasier Cir SE Unit 664
- 647 Frasier St SE
- 632 Frasier St SE Unit 634
- 632 Frasier St SE
- 639 Frasier St SE Unit 641
- 661 Frasier Cir SE
- 630 Frasier St SE
- 630 Frasier St SE Unit 630
- 663 Frasier Cir SE Unit 663
- 210 Park St SE Unit 212
- 672 Frasier Cir SE