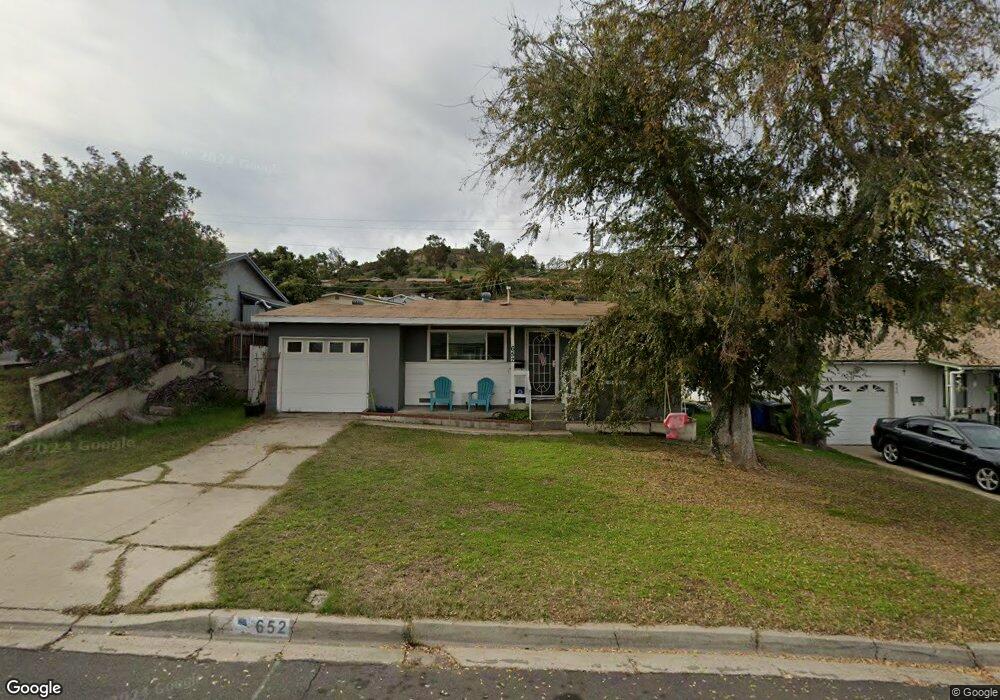
652 Hillsview Rd El Cajon, CA 92020
Fletcher Hills NeighborhoodEstimated Value: $601,000 - $754,000
3
Beds
1
Bath
896
Sq Ft
$739/Sq Ft
Est. Value
About This Home
This home is located at 652 Hillsview Rd, El Cajon, CA 92020 and is currently estimated at $662,189, approximately $739 per square foot. 652 Hillsview Rd is a home located in San Diego County with nearby schools including Flying Hills Elementary School, West Hills High School, and Grossmont Secondary School.
Ownership History
Date
Name
Owned For
Owner Type
Purchase Details
Closed on
Oct 30, 2017
Sold by
Zuniga Robyn
Bought by
Quero Remi Jose Marie
Current Estimated Value
Purchase Details
Closed on
Oct 14, 2015
Sold by
Zuniga Robyn
Bought by
Zuniga Robyn
Home Financials for this Owner
Home Financials are based on the most recent Mortgage that was taken out on this home.
Original Mortgage
$160,500
Interest Rate
3.86%
Mortgage Type
New Conventional
Purchase Details
Closed on
May 4, 1998
Sold by
Va
Bought by
Zuniga Robyn
Home Financials for this Owner
Home Financials are based on the most recent Mortgage that was taken out on this home.
Original Mortgage
$116,100
Interest Rate
7.13%
Mortgage Type
Seller Take Back
Purchase Details
Closed on
Oct 9, 1997
Sold by
Bunn Eugene D and Bunn Denise G
Bought by
Countrywide Home Loans Inc
Purchase Details
Closed on
Oct 8, 1997
Sold by
Countrywide Home Loans Inc
Bought by
Va
Purchase Details
Closed on
Jun 29, 1984
Create a Home Valuation Report for This Property
The Home Valuation Report is an in-depth analysis detailing your home's value as well as a comparison with similar homes in the area
Home Values in the Area
Average Home Value in this Area
Purchase History
| Date | Buyer | Sale Price | Title Company |
|---|---|---|---|
| Quero Remi Jose Marie | $310,000 | First American Title | |
| Zuniga Robyn | -- | Lawyers Title Company | |
| Zuniga Robin | -- | Lawyers Title Company | |
| Zuniga Robyn | $117,000 | First American Title | |
| Countrywide Home Loans Inc | $90,783 | Landsafe Title | |
| Va | -- | Landsafe Title | |
| -- | $71,600 | -- |
Source: Public Records
Mortgage History
| Date | Status | Borrower | Loan Amount |
|---|---|---|---|
| Previous Owner | Zuniga Robyn | $160,500 | |
| Previous Owner | Zuniga Robyn | $116,100 |
Source: Public Records
Tax History
| Year | Tax Paid | Tax Assessment Tax Assessment Total Assessment is a certain percentage of the fair market value that is determined by local assessors to be the total taxable value of land and additions on the property. | Land | Improvement |
|---|---|---|---|---|
| 2025 | $4,699 | $352,718 | $216,584 | $136,134 |
| 2024 | $4,699 | $345,803 | $212,338 | $133,465 |
| 2023 | $4,590 | $339,024 | $208,175 | $130,849 |
| 2022 | $4,340 | $332,378 | $204,094 | $128,284 |
| 2021 | $4,297 | $325,862 | $200,093 | $125,769 |
| 2020 | $4,121 | $322,522 | $198,042 | $124,480 |
| 2019 | $3,883 | $316,199 | $194,159 | $122,040 |
| 2018 | $3,820 | $310,000 | $190,352 | $119,648 |
| 2017 | $2,016 | $160,952 | $98,831 | $62,121 |
| 2016 | $1,936 | $157,797 | $96,894 | $60,903 |
| 2015 | $1,926 | $155,428 | $95,439 | $59,989 |
| 2014 | $1,890 | $152,384 | $93,570 | $58,814 |
Source: Public Records
Map
Nearby Homes
- 1387 Weers St
- 528 N Cuyamaca St
- 520 N Cuyamaca St
- 503 N Cuyamaca St
- 612 N Pierce St
- 473 Dewane Dr
- 1676 Vann Ct
- 377 El Monte Rd
- 1340 Heron Ave
- 1958 Milford Place
- 1280 W Main St Unit 6
- 1280 W Main St Unit 15
- 589 N Johnson Ave Unit 120
- 589 N Johnson Ave Unit 247
- 589 N Johnson Ave Unit 259
- 1894 Wedgemere Rd
- 1363 Dove St
- 927 W Main St
- 874 Hacienda Dr
- 468 Manor Dr
- 660 Hillsview Rd
- 644 Hillsview Rd
- 1350 Young St
- 668 Hillsview Rd
- 1351 Chaney St
- 1366 Young St
- 1367 Chaney St
- 649 Hillsview Rd
- 657 Hillsview Rd
- 628 Hillsview Rd
- 641 Hillsview Rd
- 1380 Young St
- 665 Hillsview Rd
- 633 Hillsview Rd
- 1387 Chaney St
- 1351 Young St
- 684 Hillsview Rd
- 620 Hillsview Rd
- 673 Hillsview Rd
- 625 Hillsview Rd
Your Personal Tour Guide
Ask me questions while you tour the home.