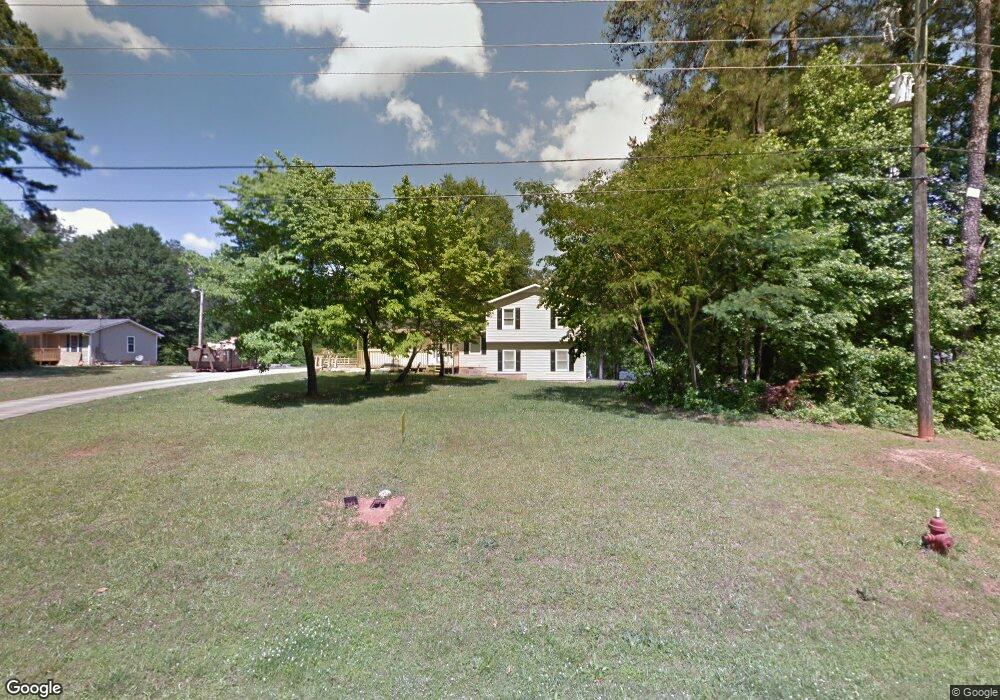
652 Ishman Ballard Rd Newnan, GA 30263
Estimated Value: $275,000 - $340,000
3
Beds
3
Baths
2,260
Sq Ft
$132/Sq Ft
Est. Value
About This Home
This home is located at 652 Ishman Ballard Rd, Newnan, GA 30263 and is currently estimated at $298,659, approximately $132 per square foot. 652 Ishman Ballard Rd is a home located in Coweta County with nearby schools including Ruth Hill Elementary School, Smokey Road Middle School, and Newnan High School.
Ownership History
Date
Name
Owned For
Owner Type
Purchase Details
Closed on
Aug 20, 1999
Sold by
Prim Elaine R
Bought by
Turner Shirley H
Current Estimated Value
Home Financials for this Owner
Home Financials are based on the most recent Mortgage that was taken out on this home.
Original Mortgage
$85,174
Outstanding Balance
$24,189
Interest Rate
7.5%
Mortgage Type
FHA
Estimated Equity
$274,470
Purchase Details
Closed on
Apr 9, 1998
Sold by
Construct Mcdowell
Bought by
Prim Elaine R
Home Financials for this Owner
Home Financials are based on the most recent Mortgage that was taken out on this home.
Original Mortgage
$67,915
Interest Rate
8.9%
Mortgage Type
New Conventional
Purchase Details
Closed on
Dec 2, 1997
Sold by
Burns Robert M
Bought by
Constructi Mcdowell
Purchase Details
Closed on
Aug 31, 1985
Bought by
Mcdowell Dennis H
Create a Home Valuation Report for This Property
The Home Valuation Report is an in-depth analysis detailing your home's value as well as a comparison with similar homes in the area
Home Values in the Area
Average Home Value in this Area
Purchase History
| Date | Buyer | Sale Price | Title Company |
|---|---|---|---|
| Turner Shirley H | $85,900 | -- | |
| Prim Elaine R | $79,900 | -- | |
| Constructi Mcdowell | $115,000 | -- | |
| Mcdowell Dennis H | -- | -- |
Source: Public Records
Mortgage History
| Date | Status | Borrower | Loan Amount |
|---|---|---|---|
| Open | Turner Shirley H | $85,174 | |
| Previous Owner | Prim Elaine R | $67,915 |
Source: Public Records
Tax History Compared to Growth
Tax History
| Year | Tax Paid | Tax Assessment Tax Assessment Total Assessment is a certain percentage of the fair market value that is determined by local assessors to be the total taxable value of land and additions on the property. | Land | Improvement |
|---|---|---|---|---|
| 2024 | $589 | $85,192 | $8,000 | $77,192 |
| 2023 | $589 | $74,637 | $8,000 | $66,637 |
| 2022 | $461 | $63,048 | $8,000 | $55,048 |
| 2021 | $426 | $56,000 | $8,000 | $48,000 |
| 2020 | $425 | $56,000 | $8,000 | $48,000 |
| 2019 | $433 | $50,248 | $8,000 | $42,248 |
| 2018 | $627 | $50,248 | $8,000 | $42,248 |
| 2017 | $626 | $50,248 | $8,000 | $42,248 |
| 2016 | $364 | $41,685 | $6,000 | $35,685 |
| 2015 | $347 | $41,685 | $6,000 | $35,685 |
| 2014 | $337 | $41,685 | $6,000 | $35,685 |
Source: Public Records
Map
Nearby Homes
- 50 Hearthstone Dr
- 68 Timberland Trail
- 130 Wallace Gray Cir
- 124 Wallace Gray Cir
- 713 Smokey Rd
- 0 Wallace Gray Cir Unit 10590659
- 48 Wallace Gray Ct
- 56 Fox Hollow Run
- 16 Fayme Ct
- Zoey II Plan at Chapel Hill
- Middleton Plan at Chapel Hill
- Radcliffe Plan at Chapel Hill
- Horizon Plan at Chapel Hill
- Alexis Plan at Chapel Hill
- Reagan Plan at Chapel Hill
- Millhaven Plan at Chapel Hill
- Drayton Plan at Chapel Hill
- Everest III Plan at Chapel Hill
- Jordan Plan at Chapel Hill
- 623 Belk Rd
- 670 Ishman Ballard Rd
- 642 Ishman Ballard Rd
- 700 Ishman Ballard Rd
- 604 Ishman Ballard Rd
- 637 Ishman Ballard Rd
- 180 Hearthstone Dr S
- 190 Hearthstone Dr W
- 190 Hearthstone Dr
- 190 Hearthstone Dr
- 190 Hearthstone Dr Unit 3
- 682 Ishman Ballard Rd
- 715 Ishman Ballard Rd
- 714 Ishman Ballard Rd
- 170 Hearthstone Dr
- 170 Hearthstone Dr S
- 611 Ishman Ballard Rd
- 598 Ishman Ballard Rd
- 686 Ishman Ballard Rd
- 684 Ishman Ballard Rd
- 38 Essie Walker Rd