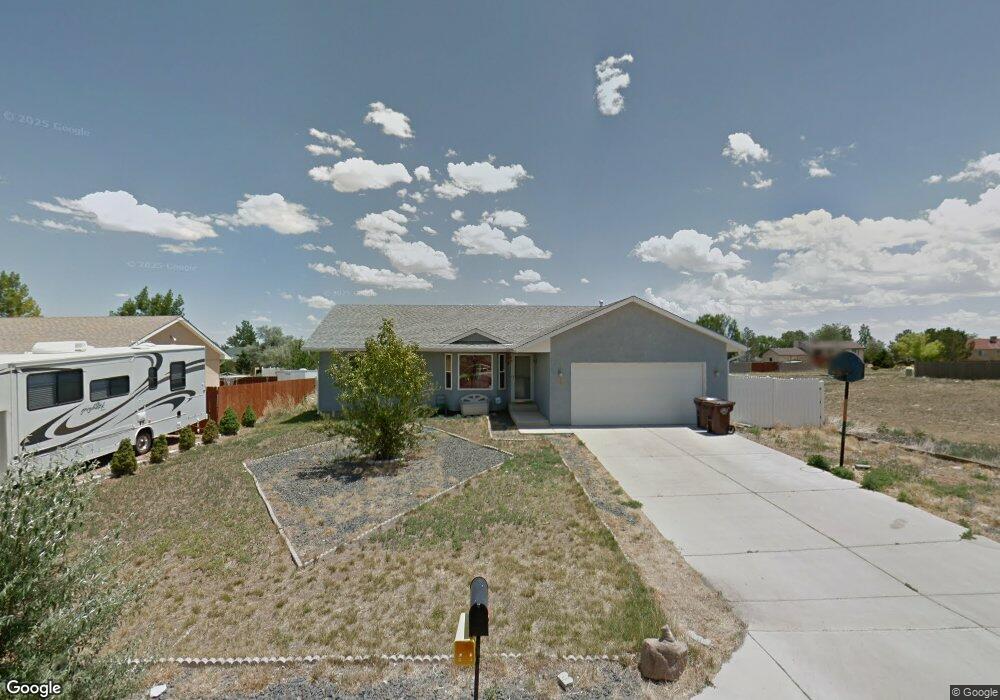
652 S Bond Dr E Unit 4 Pueblo, CO 81007
Estimated Value: $298,000 - $327,000
3
Beds
2
Baths
1,319
Sq Ft
$236/Sq Ft
Est. Value
About This Home
This home is located at 652 S Bond Dr E Unit 4, Pueblo, CO 81007 and is currently estimated at $310,668, approximately $235 per square foot. 652 S Bond Dr E Unit 4 is a home located in Pueblo County with nearby schools including Liberty Point Elementary School, Liberty Point International School, and Pueblo West High School.
Ownership History
Date
Name
Owned For
Owner Type
Purchase Details
Closed on
Jan 21, 2014
Sold by
Meiu Evelyn D and Meiu Kelly J
Bought by
Meiu Evelyn D and Meiu Kelly J
Current Estimated Value
Purchase Details
Closed on
Nov 14, 2013
Sold by
Orr Greg
Bought by
Meiu Evelyn D and Meiu Kelly J
Home Financials for this Owner
Home Financials are based on the most recent Mortgage that was taken out on this home.
Original Mortgage
$80,000
Outstanding Balance
$59,047
Interest Rate
4.28%
Mortgage Type
New Conventional
Estimated Equity
$251,621
Purchase Details
Closed on
Apr 21, 2011
Sold by
Baca Swindells Mary Ann
Bought by
Baca Swindells Mary Ann
Purchase Details
Closed on
Jul 31, 2003
Sold by
Swindells Mary Ann Baca
Bought by
Swindells Mary A B + Gary A
Purchase Details
Closed on
Apr 22, 2003
Sold by
Jones John Y + Judy C
Bought by
North Creek Enterprises Llc
Purchase Details
Closed on
Aug 12, 1980
Sold by
Lawyers Title
Bought by
Jones John Y + Judy C
Create a Home Valuation Report for This Property
The Home Valuation Report is an in-depth analysis detailing your home's value as well as a comparison with similar homes in the area
Home Values in the Area
Average Home Value in this Area
Purchase History
| Date | Buyer | Sale Price | Title Company |
|---|---|---|---|
| Meiu Evelyn D | -- | None Available | |
| Meiu Evelyn D | $100,000 | None Available | |
| Baca Swindells Mary Ann | -- | None Available | |
| Swindells Mary A B + Gary A | -- | -- | |
| North Creek Enterprises Llc | $9,000 | -- | |
| Jones John Y + Judy C | $4,800 | -- |
Source: Public Records
Mortgage History
| Date | Status | Borrower | Loan Amount |
|---|---|---|---|
| Open | Meiu Evelyn D | $80,000 |
Source: Public Records
Tax History
| Year | Tax Paid | Tax Assessment Tax Assessment Total Assessment is a certain percentage of the fair market value that is determined by local assessors to be the total taxable value of land and additions on the property. | Land | Improvement |
|---|---|---|---|---|
| 2024 | $1,012 | $16,660 | -- | -- |
| 2023 | $1,692 | $20,350 | $3,350 | $17,000 |
| 2022 | $1,502 | $14,973 | $2,090 | $12,883 |
| 2021 | $1,540 | $15,400 | $2,150 | $13,250 |
| 2020 | $1,296 | $15,400 | $2,150 | $13,250 |
| 2019 | $1,292 | $12,925 | $486 | $12,439 |
| 2018 | $1,128 | $11,280 | $490 | $10,790 |
| 2017 | $1,129 | $11,280 | $490 | $10,790 |
| 2016 | $1,068 | $10,692 | $716 | $9,976 |
| 2015 | $1,060 | $10,692 | $716 | $9,976 |
| 2014 | $920 | $9,280 | $796 | $8,484 |
Source: Public Records
Map
Nearby Homes
- 649 S Bond Dr E
- 642 S Bow Mar Dr
- 662 S Bayfield Ave
- 649 S Bayfield Ave
- 381 E Joe Martinez Blvd
- 393 E Joe Martinez Blvd
- 341 E Stanley Dr
- 448 S Joe Martinez Blvd
- 1110 S Purcell Blvd
- 602 S Del Rio Dr
- 437 S Purcell Blvd
- 876 S Purcell Blvd
- 451 S Purcell Blvd
- 241 E Don Dr
- 311 E Stewart Dr
- 243 E George Dr
- 601 S Inca Dr
- 741 Gadsden Dr
- 487 E Latimer Ln
- 890 S Cellini Plaza
- 652 S Bond Dr E
- 658 S Bond Dr E
- 650 S Bond Dr E
- 662 S Bond Dr E
- 646 S Bond Dr E Unit 2
- 646 S Bond Dr E
- 657 S Bond Dr E
- 635 S Camrose Dr
- 641 S Camrose Dr
- 653 S Bond Dr
- 653 S Bond Dr
- 653 S Bond Dr Unit 19
- 668 S Bond Dr E
- 668 S Bond Dr E Unit 7
- 665 S Bond Dr E
- 398 E Maher Dr
- 647 S Camrose Dr
- 670 S Bond Dr E
- 353 E Bond Place
- 669 S Bond Dr E
Your Personal Tour Guide
Ask me questions while you tour the home.