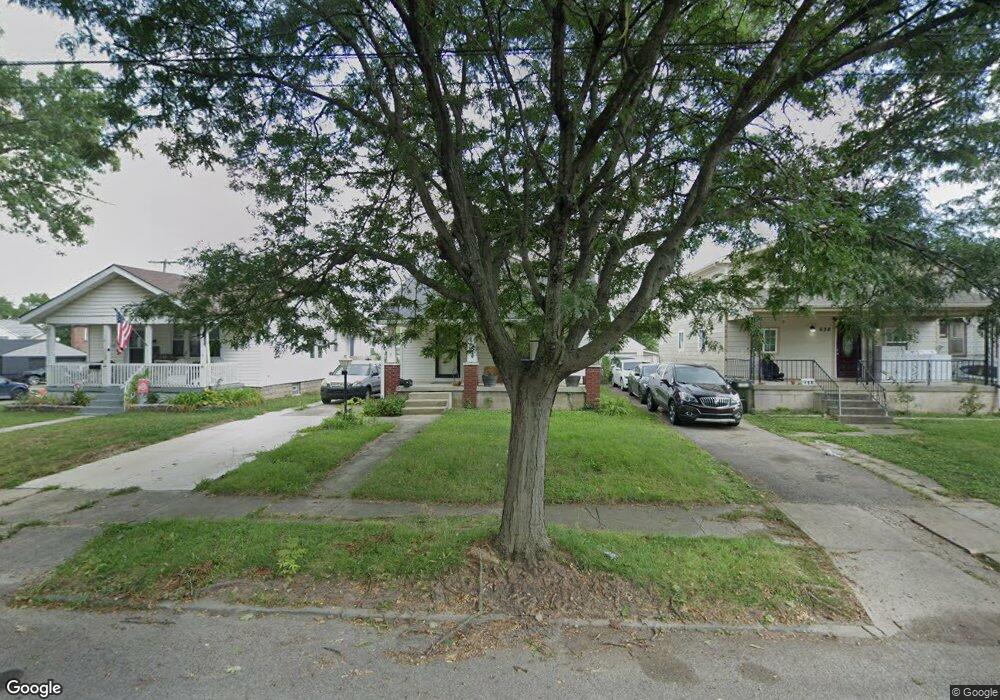
652 S Harris Ave Columbus, OH 43204
South Central Hilltop NeighborhoodEstimated Value: $148,728 - $214,000
3
Beds
2
Baths
1,493
Sq Ft
$118/Sq Ft
Est. Value
About This Home
This home is located at 652 S Harris Ave, Columbus, OH 43204 and is currently estimated at $175,932, approximately $117 per square foot. 652 S Harris Ave is a home located in Franklin County with nearby schools including Burroughs Elementary School, Hilltonia Middle School, and Briggs High School.
Ownership History
Date
Name
Owned For
Owner Type
Purchase Details
Closed on
May 25, 2017
Sold by
Second Restated Claudette Sue Kenney Tru
Bought by
Lusk Christopher L
Current Estimated Value
Home Financials for this Owner
Home Financials are based on the most recent Mortgage that was taken out on this home.
Original Mortgage
$58,400
Outstanding Balance
$29,326
Interest Rate
4.03%
Mortgage Type
New Conventional
Estimated Equity
$146,606
Purchase Details
Closed on
May 14, 2009
Sold by
Kenney Claudette Sue
Bought by
Lusk Christopher I
Home Financials for this Owner
Home Financials are based on the most recent Mortgage that was taken out on this home.
Original Mortgage
$70,000
Interest Rate
4.83%
Mortgage Type
Seller Take Back
Purchase Details
Closed on
Aug 22, 2001
Sold by
Kenney Claudette S
Bought by
Restated Kenney Claudette Sue and Restated Claudette Sue Kenney
Purchase Details
Closed on
Jun 6, 1997
Sold by
Development Secretary Of Housing & Urban
Bought by
Kenney Claudette Sue
Purchase Details
Closed on
Dec 3, 1992
Create a Home Valuation Report for This Property
The Home Valuation Report is an in-depth analysis detailing your home's value as well as a comparison with similar homes in the area
Home Values in the Area
Average Home Value in this Area
Purchase History
| Date | Buyer | Sale Price | Title Company |
|---|---|---|---|
| Lusk Christopher L | $70,000 | Elite Land Title | |
| Kenney Claudette Sue | -- | Elite Land Title | |
| Lusk Christopher I | $70,000 | Attorney | |
| Restated Kenney Claudette Sue | -- | -- | |
| Kenney Claudette Sue | -- | -- | |
| -- | $48,000 | -- |
Source: Public Records
Mortgage History
| Date | Status | Borrower | Loan Amount |
|---|---|---|---|
| Open | Lusk Christopher L | $58,400 | |
| Previous Owner | Lusk Christopher I | $70,000 |
Source: Public Records
Tax History
| Year | Tax Paid | Tax Assessment Tax Assessment Total Assessment is a certain percentage of the fair market value that is determined by local assessors to be the total taxable value of land and additions on the property. | Land | Improvement |
|---|---|---|---|---|
| 2025 | $1,774 | $39,520 | $4,520 | $35,000 |
| 2024 | $1,774 | $39,520 | $4,520 | $35,000 |
| 2023 | $1,751 | $39,515 | $4,515 | $35,000 |
| 2022 | $1,291 | $24,890 | $1,820 | $23,070 |
| 2021 | $1,293 | $24,890 | $1,820 | $23,070 |
| 2020 | $1,295 | $24,890 | $1,820 | $23,070 |
| 2019 | $1,295 | $21,350 | $1,540 | $19,810 |
| 2018 | $1,277 | $21,350 | $1,540 | $19,810 |
| 2017 | $1,327 | $21,350 | $1,540 | $19,810 |
| 2016 | $1,389 | $20,970 | $6,830 | $14,140 |
| 2015 | $1,261 | $20,970 | $6,830 | $14,140 |
| 2014 | $1,264 | $20,970 | $6,830 | $14,140 |
| 2013 | $733 | $24,640 | $8,015 | $16,625 |
Source: Public Records
Map
Nearby Homes
- 623 S Harris Ave
- 686 Racine Ave
- 677 S Warren Ave
- 641 S Warren Ave
- 596 - 598 Racine Ave
- 620 S Warren Ave
- 570 Wiltshire Rd
- 733 S Hague Ave
- 2715 Sullivant Ave
- 640 Chestershire Rd
- 2835 Sullivant Ave
- 599 S Burgess Ave Unit 601
- 510 S Warren Ave
- 642 S Roys Ave
- 2712 Eakin Rd
- 511 S Ogden Ave
- 500 S Warren Ave
- 839-841 S Ogden Ave
- 727 S Richardson Ave
- 857 Regina Ct
- 658 S Harris Ave
- 648 S Harris Ave
- 664 S Harris Ave
- 668 S Harris Ave
- 659 Racine Ave
- 636 S Harris Ave
- 663 Racine Ave
- 653 Racine Ave
- 674 S Harris Ave
- 669 Racine Ave
- 651 S Harris Ave
- 645 S Harris Ave
- 655 S Harris Ave
- 673 Racine Ave
- 630 S Harris St
- 630 S Harris Ave
- 661 S Harris Ave
- 678 S Harris Ave
- 679 Racine Ave
- 635-641 Racine Ave
Your Personal Tour Guide
Ask me questions while you tour the home.