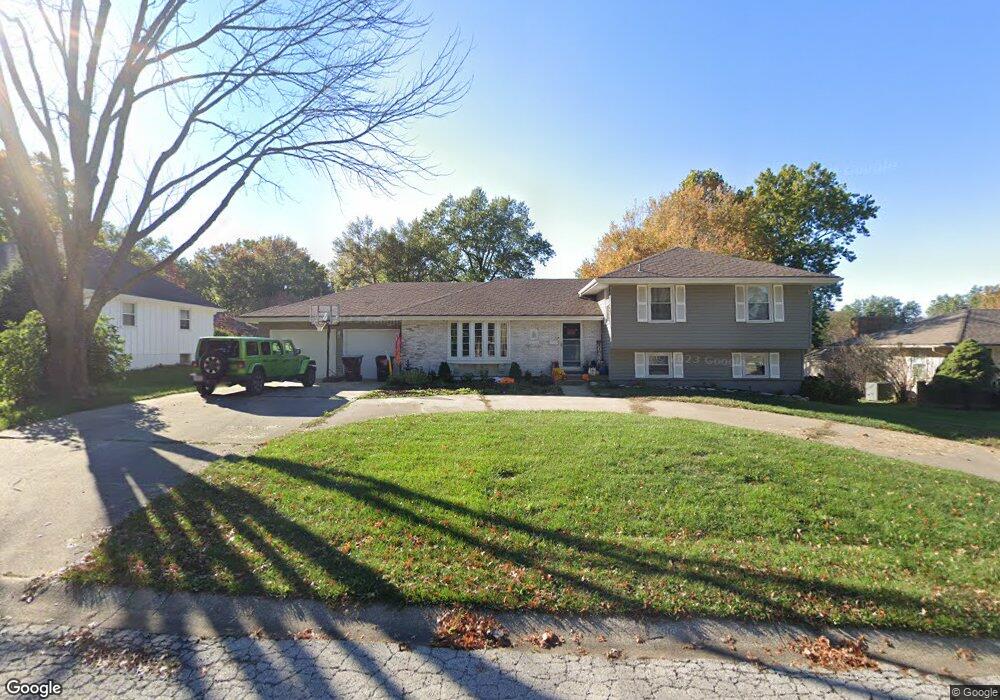
6520 Claremont Ave Raytown, MO 64133
Estimated Value: $218,000 - $271,526
3
Beds
3
Baths
1,440
Sq Ft
$174/Sq Ft
Est. Value
About This Home
This home is located at 6520 Claremont Ave, Raytown, MO 64133 and is currently estimated at $250,382, approximately $173 per square foot. 6520 Claremont Ave is a home located in Jackson County with nearby schools including Norfleet Elementary School, Raytown Central Middle School, and Raytown South High School.
Ownership History
Date
Name
Owned For
Owner Type
Purchase Details
Closed on
Apr 27, 2020
Sold by
Melson Mark W and Melson Kerri J
Bought by
Riggs Ashley Charlotte
Current Estimated Value
Home Financials for this Owner
Home Financials are based on the most recent Mortgage that was taken out on this home.
Original Mortgage
$162,000
Outstanding Balance
$144,049
Interest Rate
3.6%
Mortgage Type
New Conventional
Estimated Equity
$106,333
Purchase Details
Closed on
Sep 30, 2019
Sold by
Smith Thomas F and England Susan M
Bought by
Melson Mark W
Purchase Details
Closed on
Jan 13, 2012
Sold by
Smith Thomas F
Bought by
Smith Thomas F and England Susan M
Purchase Details
Closed on
Aug 31, 2001
Sold by
Smith Thomas F and Smith Patricia D
Bought by
England Susan Smith and Smith Julie A
Create a Home Valuation Report for This Property
The Home Valuation Report is an in-depth analysis detailing your home's value as well as a comparison with similar homes in the area
Home Values in the Area
Average Home Value in this Area
Purchase History
| Date | Buyer | Sale Price | Title Company |
|---|---|---|---|
| Riggs Ashley Charlotte | -- | None Available | |
| Melson Mark W | -- | None Available | |
| Smith Thomas F | -- | None Available | |
| England Susan Smith | -- | -- |
Source: Public Records
Mortgage History
| Date | Status | Borrower | Loan Amount |
|---|---|---|---|
| Open | Riggs Ashley Charlotte | $162,000 |
Source: Public Records
Tax History Compared to Growth
Tax History
| Year | Tax Paid | Tax Assessment Tax Assessment Total Assessment is a certain percentage of the fair market value that is determined by local assessors to be the total taxable value of land and additions on the property. | Land | Improvement |
|---|---|---|---|---|
| 2025 | $3,906 | $36,685 | $5,540 | $31,145 |
| 2024 | $3,880 | $43,303 | $5,214 | $38,089 |
| 2023 | $3,880 | $43,303 | $4,775 | $38,528 |
| 2022 | $2,609 | $27,740 | $3,356 | $24,384 |
| 2021 | $2,618 | $27,740 | $3,356 | $24,384 |
| 2020 | $2,523 | $26,477 | $3,356 | $23,121 |
| 2019 | $2,510 | $26,477 | $3,356 | $23,121 |
| 2018 | $2,109 | $23,044 | $2,921 | $20,123 |
| 2017 | $2,109 | $23,044 | $2,921 | $20,123 |
| 2016 | $2,045 | $22,466 | $3,914 | $18,552 |
| 2014 | $2,007 | $21,812 | $3,800 | $18,012 |
Source: Public Records
Map
Nearby Homes
- 6716 Sterling Ave
- 6407 Harvard Ave
- 6423 Harris Ave
- 6410 Harvard Ave
- 6710 Woodson Rd
- 6727 Harvard Ave
- 6812 Wildwood Dr
- 6711 Appleton Ave
- 6322 Norwood Ct
- 6317 Harvard Ave
- 6716 Appleton Ave
- 10800 Lakeview Rd
- 6828 Vermont Ave
- 6309 Hedges Ave
- 7007 Lakeshore Dr
- 11601 E 62nd St
- 6817 Lakeshore Dr
- 6605 Willow Ave
- 6619 Willow Ave
- 11600 E 62nd St
- 6516 Claremont Ave
- 6600 Claremont Ave
- 6521 Sterling Ave
- 6601 Sterling Ave
- 6517 Sterling Ave
- 6604 Claremont Ave
- 6512 Claremont Ave
- 6519 Claremont Ave
- 6605 Sterling Ave
- 6601 Claremont Ave
- 6515 Sterling Ave
- 6515 Claremont Ave
- 6605 Claremont Ave
- 6508 Claremont Ave
- 6608 Claremont Ave
- 11405 E 65th Terrace
- 6509 Sterling Ave
- 11400 E 65th Terrace
- 6609 Sterling Ave
- 6600 Sterling Ave