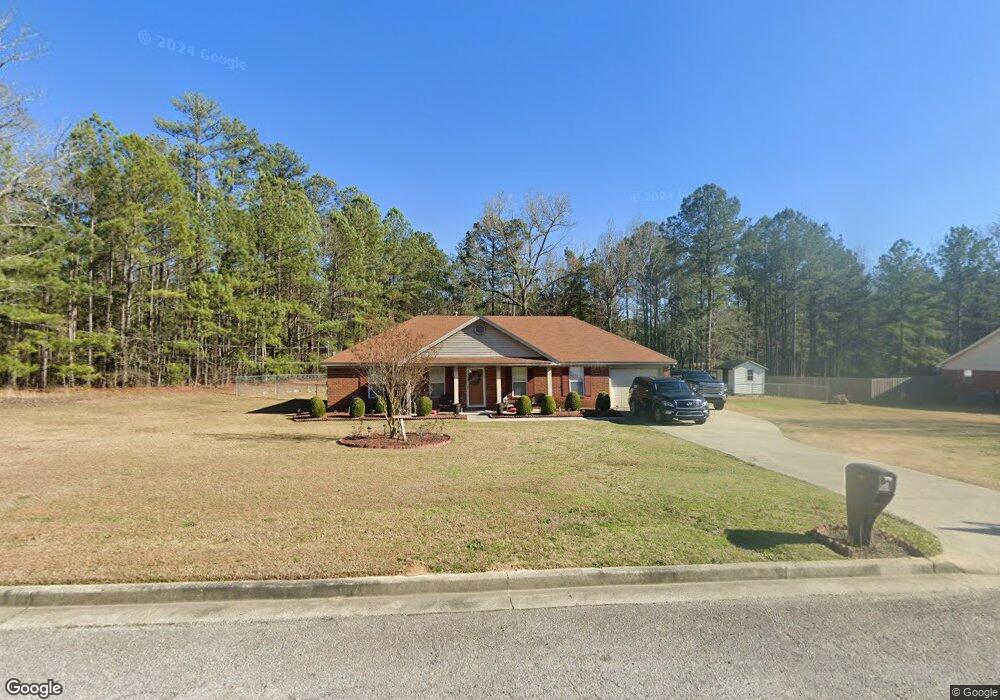
6521 Campbells Way Harlem, GA 30814
Estimated Value: $246,271 - $278,000
3
Beds
2
Baths
1,384
Sq Ft
$185/Sq Ft
Est. Value
About This Home
This home is located at 6521 Campbells Way, Harlem, GA 30814 and is currently estimated at $256,568, approximately $185 per square foot. 6521 Campbells Way is a home located in Columbia County with nearby schools including Washington Elementary School, North Harlem Elementary School, and Harlem Middle School.
Ownership History
Date
Name
Owned For
Owner Type
Purchase Details
Closed on
Dec 21, 2010
Sold by
Sect Of Veteran Affairs
Bought by
Hobbs Travis T
Current Estimated Value
Home Financials for this Owner
Home Financials are based on the most recent Mortgage that was taken out on this home.
Original Mortgage
$112,200
Outstanding Balance
$78,971
Interest Rate
4.4%
Mortgage Type
New Conventional
Estimated Equity
$177,597
Purchase Details
Closed on
Sep 9, 2002
Sold by
The Chase Manhattan Bank
Bought by
Patterson Paul O and Patterson Stella
Home Financials for this Owner
Home Financials are based on the most recent Mortgage that was taken out on this home.
Original Mortgage
$30,000
Interest Rate
6.31%
Mortgage Type
Credit Line Revolving
Purchase Details
Closed on
Aug 21, 2002
Sold by
Patterson Paul O
Bought by
Patterson Paul O and Patterson Stella
Home Financials for this Owner
Home Financials are based on the most recent Mortgage that was taken out on this home.
Original Mortgage
$30,000
Interest Rate
6.31%
Mortgage Type
Credit Line Revolving
Create a Home Valuation Report for This Property
The Home Valuation Report is an in-depth analysis detailing your home's value as well as a comparison with similar homes in the area
Home Values in the Area
Average Home Value in this Area
Purchase History
| Date | Buyer | Sale Price | Title Company |
|---|---|---|---|
| Hobbs Travis T | $101,400 | -- | |
| Hobbs Travis T | $101,400 | -- | |
| Patterson Paul O | -- | -- | |
| Patterson Paul O | -- | -- |
Source: Public Records
Mortgage History
| Date | Status | Borrower | Loan Amount |
|---|---|---|---|
| Open | Hobbs Travis T | $112,200 | |
| Previous Owner | Patterson Paul O | $30,000 |
Source: Public Records
Tax History Compared to Growth
Tax History
| Year | Tax Paid | Tax Assessment Tax Assessment Total Assessment is a certain percentage of the fair market value that is determined by local assessors to be the total taxable value of land and additions on the property. | Land | Improvement |
|---|---|---|---|---|
| 2025 | $3,118 | $100,612 | $17,647 | $82,965 |
| 2024 | $3,198 | $99,508 | $17,647 | $81,861 |
| 2023 | $3,198 | $77,988 | $14,947 | $63,041 |
| 2022 | $2,401 | $71,955 | $14,847 | $57,108 |
| 2021 | $2,187 | $62,706 | $13,647 | $49,059 |
| 2020 | $2,093 | $58,954 | $12,147 | $46,807 |
| 2019 | $1,873 | $52,497 | $11,747 | $40,750 |
| 2018 | $1,791 | $49,526 | $11,247 | $38,279 |
| 2017 | $1,803 | $49,745 | $11,247 | $38,498 |
| 2016 | $1,717 | $48,438 | $9,908 | $38,530 |
| 2015 | $1,610 | $46,618 | $9,308 | $37,310 |
| 2014 | $1,556 | $45,910 | $9,308 | $36,602 |
Source: Public Records
Map
Nearby Homes
- 652 Fairview Dr
- 652 N Fairview Dr
- 650 N Fairview Dr
- The Jefferson Plan at Hickory Woods
- The Hollins Plan at Hickory Woods
- The Easton Plan at Hickory Woods
- The Rembert Plan at Hickory Woods
- The Kershaw Plan at Hickory Woods
- The Lambert Plan at Hickory Woods
- 407 Chickadee Way
- 328 Black Oak Dr
- 344 Tupelo Pass
- 343 Tupelo Pass
- 346 Tupelo Pass
- 342 Tupelo Pass
- 331 Black Oak Dr
- 339 Black Oak Dr
- 341 Black Oak Dr
- 6517 Campbells Way
- 6517 Campbells Way
- 6515 Campbells Way
- 6522 Campbells Way
- 6518 Campbells Way
- 6513 Campbells Way
- 6520 Campbells Way
- 6516 Campbells Way
- 6524 Campbells Way
- 6511 Campbells Way
- 6514 Campbells Way
- 6505 Campbells Way
- 6512 Campbells Way
- 6501 Campbells Way
- 6510 Campbells Way
- 6506 Campbells Way
- 6508 Campbells Way
- 6504 Campbells Way
- 6499 Campbells Way
- 6502 Campbells Way