Estimated Value: $735,856 - $857,000
3
Beds
2
Baths
1,581
Sq Ft
$505/Sq Ft
Est. Value
About This Home
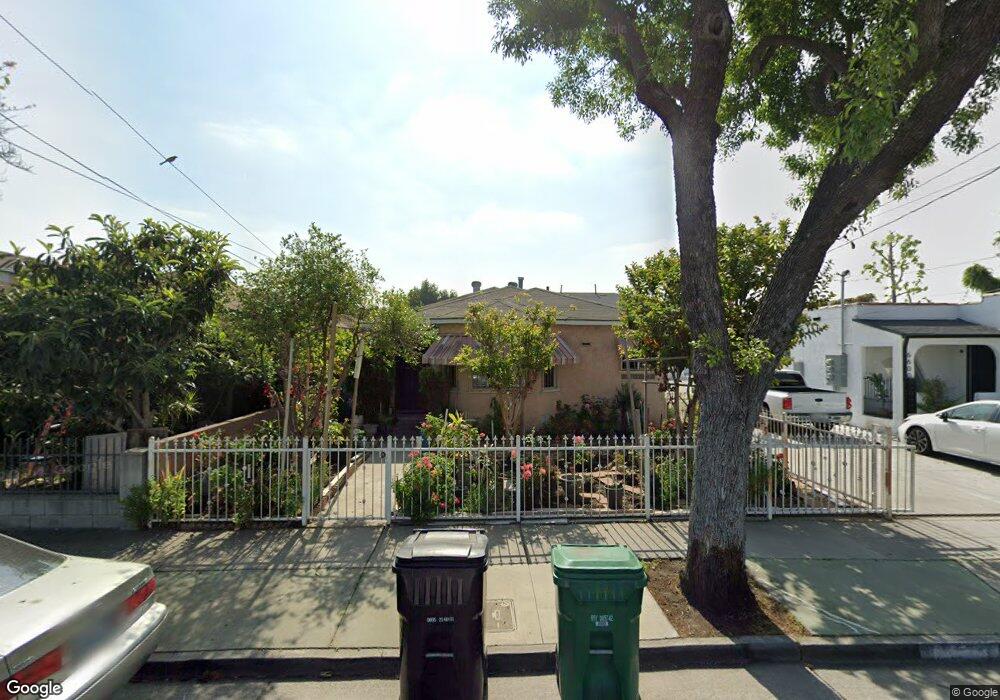
This home is located at 6524 Fishburn Ave, Bell, CA 90201 and is currently estimated at $798,464, approximately $505 per square foot. 6524 Fishburn Ave is a home located in Los Angeles County with nearby schools including Corona Avenue Elementary School, Orchard Academies 2b School, and Bell High School.
Ownership History
Date
Name
Owned For
Owner Type
Purchase Details
Closed on
Jul 31, 2024
Sold by
Parra Ana L
Bought by
Ana Parra Living Trust and Parra
Current Estimated Value
Purchase Details
Closed on
Jan 16, 2004
Sold by
Sandoval Juan M and Parra Ana L
Bought by
Sandoval Nora Ivette and Parra Ana L
Purchase Details
Closed on
Jul 13, 2001
Sold by
Sandoval Juan M and Parra Ana L
Bought by
Parra Ana L
Purchase Details
Closed on
Sep 20, 1999
Sold by
Payan Eduviges H
Bought by
Sandoval Juan M and Parra Ana L
Home Financials for this Owner
Home Financials are based on the most recent Mortgage that was taken out on this home.
Original Mortgage
$163,618
Interest Rate
5.05%
Create a Home Valuation Report for This Property
The Home Valuation Report is an in-depth analysis detailing your home's value as well as a comparison with similar homes in the area
Home Values in the Area
Average Home Value in this Area
Purchase History
| Date | Buyer | Sale Price | Title Company |
|---|---|---|---|
| Ana Parra Living Trust | -- | None Listed On Document | |
| Sandoval Nora Ivette | -- | -- | |
| Parra Ana L | -- | -- | |
| Sandoval Juan M | $182,000 | Southland Title |
Source: Public Records
Mortgage History
| Date | Status | Borrower | Loan Amount |
|---|---|---|---|
| Previous Owner | Sandoval Juan M | $163,618 |
Source: Public Records
Tax History
| Year | Tax Paid | Tax Assessment Tax Assessment Total Assessment is a certain percentage of the fair market value that is determined by local assessors to be the total taxable value of land and additions on the property. | Land | Improvement |
|---|---|---|---|---|
| 2025 | $5,009 | $510,611 | $304,995 | $205,616 |
| 2024 | $5,009 | $299,309 | $127,478 | $171,831 |
| 2023 | $4,920 | $293,441 | $124,979 | $168,462 |
| 2022 | $4,732 | $287,688 | $122,529 | $165,159 |
| 2021 | $4,678 | $282,048 | $120,127 | $161,921 |
| 2020 | $4,695 | $279,157 | $118,896 | $160,261 |
| 2019 | $4,539 | $273,684 | $116,565 | $157,119 |
| 2018 | $4,417 | $268,319 | $114,280 | $154,039 |
| 2016 | $4,332 | $257,902 | $109,844 | $148,058 |
| 2015 | $4,263 | $254,030 | $108,195 | $145,835 |
| 2014 | $4,249 | $249,055 | $106,076 | $142,979 |
Source: Public Records
Map
Nearby Homes
- 6600 Fishburn Ave
- 4026 Gage Ave
- 6522 Bear Ave
- 6509 Prospect Ave
- 4020 E 61st St
- 6072 Gifford Ave
- 6837 Mayflower Ave
- 3602 Randolph Place
- 6610 Vinevale Ave
- 4301 E 60th St
- 6048 King Ave
- 6221 Heliotrope Ave
- 7025 Vinevale Ave
- 3510 Nevada St
- 4255 Clara St Unit B
- 7105 California Ave
- 4860 Bell Ave
- 4123 Clara St
- 3427 Bell Ave
- 4503 Clara St
- 6520 Fishburn Ave
- 6600 Fishburn Ave Unit A
- 6600 Fishburn Ave Unit B
- 6516 Fishburn Ave
- 6602 Fishburn Ave
- 6514 Fishburn Ave
- 6529 Flora Ave
- 6525 Flora Ave
- 6517 Flora Ave
- 6608 Fishburn Ave
- 6508 Fishburn Ave
- 6605 Flora Ave
- 6529 Fishburn Ave
- 6523 Fishburn Ave
- 6513 Flora Ave
- 6517 Fishburn Ave
- 6504 Fishburn Ave
- 6616 Fishburn Ave
- 6515 Fishburn Ave
- 6509 Flora Ave
Your Personal Tour Guide
Ask me questions while you tour the home.