6524 Lowell St NE Albuquerque, NM 87111
Antelope Run NeighborhoodEstimated Value: $692,000 - $766,000
4
Beds
2
Baths
2,631
Sq Ft
$276/Sq Ft
Est. Value
About This Home
This home is located at 6524 Lowell St NE, Albuquerque, NM 87111 and is currently estimated at $725,693, approximately $275 per square foot. 6524 Lowell St NE is a home located in Bernalillo County with nearby schools including Georgia O'Keefe Elementary School, Eisenhower Middle School, and La Cueva High School.
Ownership History
Date
Name
Owned For
Owner Type
Purchase Details
Closed on
Nov 6, 2018
Sold by
Friede Lonnie C
Bought by
Travelstead Ann E and Travelstead Charles W
Current Estimated Value
Home Financials for this Owner
Home Financials are based on the most recent Mortgage that was taken out on this home.
Original Mortgage
$282,500
Outstanding Balance
$247,400
Interest Rate
4.7%
Mortgage Type
New Conventional
Estimated Equity
$478,293
Purchase Details
Closed on
May 25, 2005
Sold by
Tellez Investments Llc
Bought by
Cole Fried Partnership
Purchase Details
Closed on
Dec 13, 1999
Sold by
Friede Lonnie C and Friede Sharon A
Bought by
Friede Lonnie C and Friede Sharon A
Purchase Details
Closed on
Jul 19, 1999
Sold by
Friede Lonnie C and Friede Sharon A
Bought by
Friede Lonnie C and Friede Sharon A
Home Financials for this Owner
Home Financials are based on the most recent Mortgage that was taken out on this home.
Original Mortgage
$331,500
Interest Rate
9%
Create a Home Valuation Report for This Property
The Home Valuation Report is an in-depth analysis detailing your home's value as well as a comparison with similar homes in the area
Home Values in the Area
Average Home Value in this Area
Purchase History
| Date | Buyer | Sale Price | Title Company |
|---|---|---|---|
| Travelstead Ann E | -- | Fidelity National Title Ins | |
| Cole Fried Partnership | -- | None Available | |
| Friede Lonnie C | -- | Rio Grande Title Company Inc | |
| Friede Lonnie C | -- | Rio Grande Title Company Inc | |
| Friede Lonnie C | -- | Rio Grande Title Company Inc |
Source: Public Records
Mortgage History
| Date | Status | Borrower | Loan Amount |
|---|---|---|---|
| Open | Travelstead Ann E | $282,500 | |
| Previous Owner | Friede Lonnie C | $331,500 |
Source: Public Records
Tax History Compared to Growth
Tax History
| Year | Tax Paid | Tax Assessment Tax Assessment Total Assessment is a certain percentage of the fair market value that is determined by local assessors to be the total taxable value of land and additions on the property. | Land | Improvement |
|---|---|---|---|---|
| 2025 | $7,868 | $194,151 | $47,757 | $146,394 |
| 2024 | $7,868 | $188,496 | $46,366 | $142,130 |
| 2023 | $7,735 | $183,006 | $45,015 | $137,991 |
| 2022 | $7,472 | $177,677 | $43,705 | $133,972 |
| 2021 | $7,219 | $172,502 | $42,432 | $130,070 |
| 2020 | $7,098 | $167,477 | $41,196 | $126,281 |
| 2019 | $6,887 | $162,599 | $39,996 | $122,603 |
| 2018 | $5,799 | $166,483 | $39,996 | $126,487 |
| 2017 | $5,618 | $138,122 | $45,015 | $93,107 |
| 2016 | $5,454 | $130,195 | $42,432 | $87,763 |
| 2015 | $126,403 | $126,403 | $41,196 | $85,207 |
| 2014 | $5,126 | $122,721 | $39,996 | $82,725 |
| 2013 | -- | $123,588 | $39,996 | $83,592 |
Source: Public Records
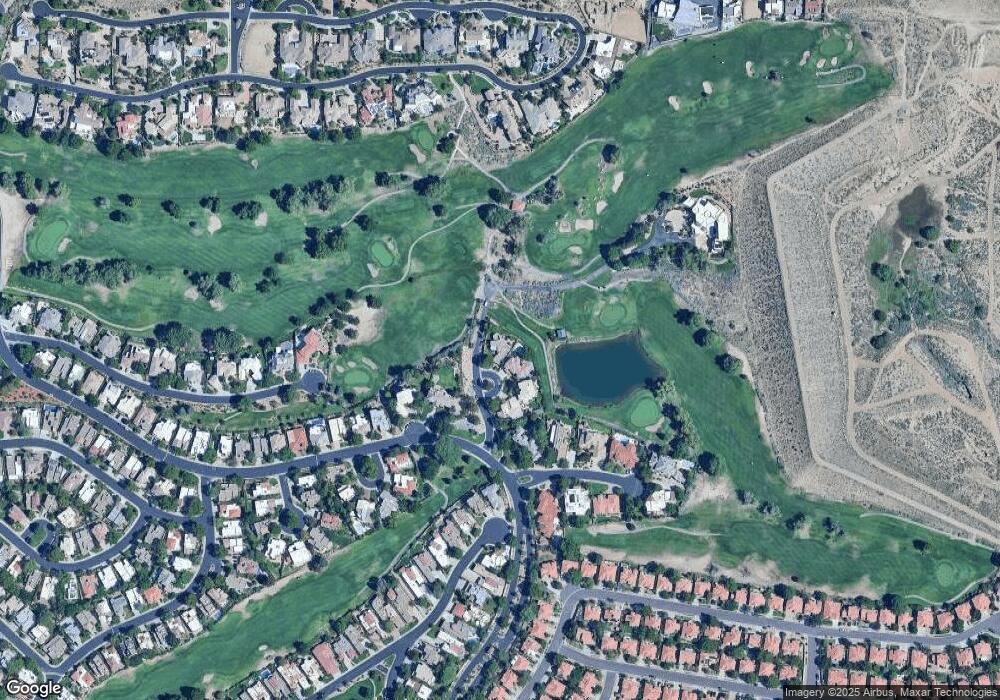
Map
Nearby Homes
- 11829 Caribou Ave NE
- 11628 Woodmar Ln NE
- 11908 Oryx Place NE
- 6225 Peachtree Place NE
- 11315 Penfield Ln NE
- 6112 Innsbrook Ct NE
- 6109 Chamblee Ct NE
- 11419 Costa Del Sol NE
- 11425 Malaguena Ln NE
- 11216 Woodmar Ln NE
- 11108 Double Eagle NE
- 11907 San Rafael Ave NE
- 12405 Royal Oak Ct NE
- 12501 Mckay Way NE
- 12724 Sandia Ridge Place NE
- 2108 Navajo Willow Dr NE
- 12616 Northern Sky Ave NE
- 11041 Academy Ridge Rd NE
- 5712 Papaya Place NE
- 12612 Desert Marigold Ln NE
- 6520 Lowell St NE
- 6516 Lowell St NE
- 11735 Sky Valley Way NE
- 11801 Baccarat Ln NE
- 11731 Sky Valley Way NE
- 11805 Baccarat Ln NE
- 11809 Baccarat Ln NE
- 11741 Sky Valley Way NE
- 11733 Woodmar Ln NE
- 11744 Sky Valley Way NE
- 11815 Baccarat Ln NE
- 11729 Woodmar Ln NE
- 11800 Baccarat Ln NE
- 11737 Sky Valley Way NE
- 11740 Sky Valley Way NE
- 11804 Baccarat Ln NE
- 11725 Woodmar Ln NE
- 11729 Sky Valley Way NE
- 11621 Paganica Way NE
- 11621 Paganica (Vrm) Way