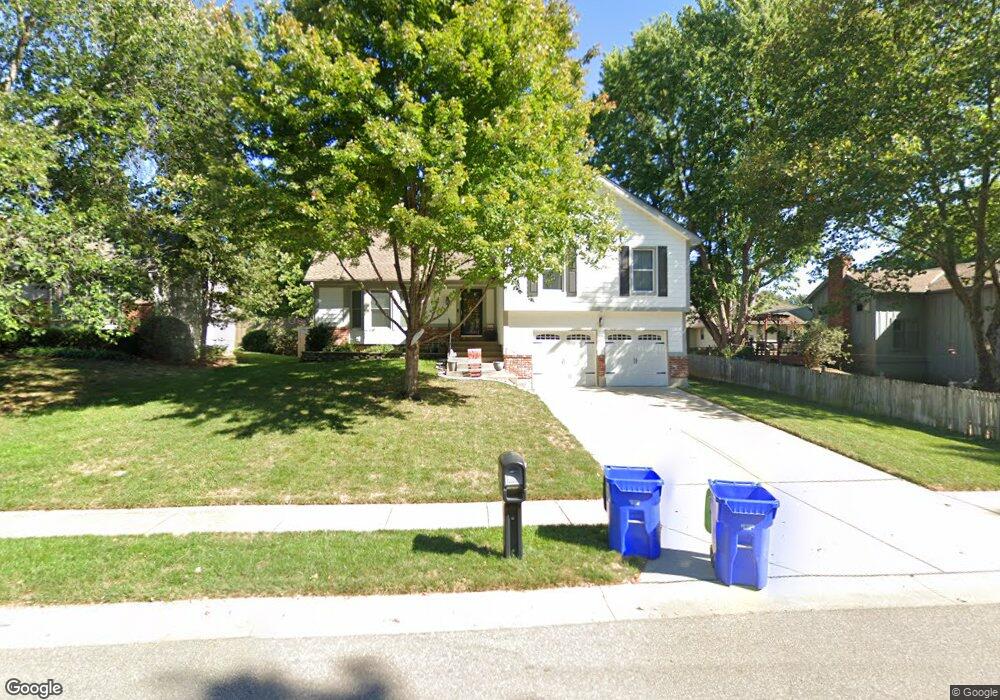
6525 Rosehill Rd Shawnee, KS 66216
Estimated Value: $377,470 - $400,000
3
Beds
3
Baths
1,513
Sq Ft
$257/Sq Ft
Est. Value
About This Home
This home is located at 6525 Rosehill Rd, Shawnee, KS 66216 and is currently estimated at $388,618, approximately $256 per square foot. 6525 Rosehill Rd is a home located in Johnson County with nearby schools including Rhein Benninghoven Elementary School, Trailridge Middle School, and Shawnee Mission Northwest High School.
Ownership History
Date
Name
Owned For
Owner Type
Purchase Details
Closed on
Aug 15, 2019
Sold by
Carpenter Sheldon I and Carpenter Kirstin P
Bought by
Carpenter Sheldon I and Carpenter Kirstin P
Current Estimated Value
Purchase Details
Closed on
Aug 6, 2002
Sold by
Wellman Mary E and Schlautman Mary E
Bought by
Carpenter Sheldon I and Carpenter Kirstin P
Home Financials for this Owner
Home Financials are based on the most recent Mortgage that was taken out on this home.
Original Mortgage
$166,815
Outstanding Balance
$70,487
Interest Rate
6.53%
Estimated Equity
$318,131
Purchase Details
Closed on
May 23, 2001
Sold by
Bernard Brett C and Bernard Susan J
Bought by
Schlautman Mary E
Home Financials for this Owner
Home Financials are based on the most recent Mortgage that was taken out on this home.
Original Mortgage
$111,650
Interest Rate
7.07%
Mortgage Type
FHA
Create a Home Valuation Report for This Property
The Home Valuation Report is an in-depth analysis detailing your home's value as well as a comparison with similar homes in the area
Home Values in the Area
Average Home Value in this Area
Purchase History
| Date | Buyer | Sale Price | Title Company |
|---|---|---|---|
| Carpenter Sheldon I | -- | None Available | |
| Carpenter Sheldon I | -- | Security Land Title Company | |
| Schlautman Mary E | -- | Old Republic Title Company O |
Source: Public Records
Mortgage History
| Date | Status | Borrower | Loan Amount |
|---|---|---|---|
| Open | Carpenter Sheldon I | $166,815 | |
| Previous Owner | Schlautman Mary E | $111,650 |
Source: Public Records
Tax History Compared to Growth
Tax History
| Year | Tax Paid | Tax Assessment Tax Assessment Total Assessment is a certain percentage of the fair market value that is determined by local assessors to be the total taxable value of land and additions on the property. | Land | Improvement |
|---|---|---|---|---|
| 2024 | $4,287 | $40,503 | $7,156 | $33,347 |
| 2023 | $4,105 | $38,283 | $7,156 | $31,127 |
| 2022 | $3,655 | $33,982 | $6,218 | $27,764 |
| 2021 | $3,528 | $30,762 | $5,651 | $25,111 |
| 2020 | $3,347 | $28,796 | $5,138 | $23,658 |
| 2019 | $3,158 | $27,140 | $4,669 | $22,471 |
| 2018 | $2,962 | $25,346 | $4,669 | $20,677 |
| 2017 | $2,845 | $23,966 | $4,062 | $19,904 |
| 2016 | $2,804 | $23,322 | $4,062 | $19,260 |
| 2015 | $2,535 | $21,908 | $4,062 | $17,846 |
| 2013 | -- | $20,183 | $4,062 | $16,121 |
Source: Public Records
Map
Nearby Homes
- 12914 W 67th St
- 12225 W 64th Terrace
- 6556 Charles St
- 6564 Charles St
- 6610 Halsey St
- 12300 W 67th Terrace
- 12116 W 63rd Terrace
- 13415 W 66th Terrace
- 6640 Pflumm Rd
- 4908 Noland Rd
- 11637 W 68th Terrace
- Augusta Plan at Kenneth Estates
- Newport Plan at Kenneth Estates
- Rosemount II Plan at Kenneth Estates
- The Avala Villa Plan at Kenneth Estates
- The Rosemount Villa Plan at Kenneth Estates
- Catalina II Plan at Kenneth Estates
- The Avala Plan at Kenneth Estates
- 12811 W 71st St
- 7105 Richards Dr
- 6521 Rosehill Rd
- 12642 W 66th St
- 12636 W 66th St
- 12627 W 65th Terrace
- 6524 Rosehill Rd
- 12630 W 66th St
- 12704 W 66th St
- 12623 W 65th Terrace
- 6520 Rosehill Rd
- 6516 Rosehill Rd
- 12624 W 66th St
- 12632 W 65th St
- 12628 W 65th Terrace
- 12708 W 66th St
- 12641 W 66th St
- 12635 W 66th St
- 12624 W 65th Terrace
- 12619 W 65th Terrace
- 12705 W 65th St
- 6602 Rosehill Rd